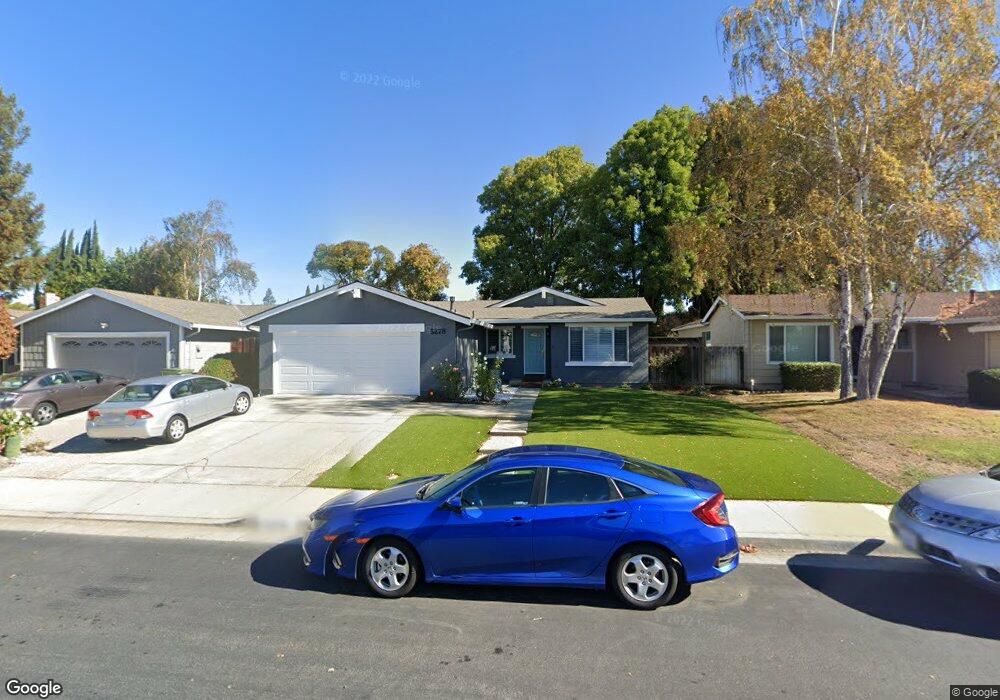
5278 Running Bear Dr San Jose, CA 95136
Hayes NeighborhoodEstimated Value: $1,259,745 - $1,331,000
3
Beds
2
Baths
1,358
Sq Ft
$946/Sq Ft
Est. Value
About This Home
This home is located at 5278 Running Bear Dr, San Jose, CA 95136 and is currently estimated at $1,284,436, approximately $945 per square foot. 5278 Running Bear Dr is a home located in Santa Clara County with nearby schools including Hayes Elementary School, Davis (Caroline) Intermediate School, and Oak Grove High School.
Ownership History
Date
Name
Owned For
Owner Type
Purchase Details
Closed on
Jul 21, 2011
Sold by
Rogers Lanson E and Rogers Renee E
Bought by
Rogers Lanson E and Rogers Renee E
Current Estimated Value
Create a Home Valuation Report for This Property
The Home Valuation Report is an in-depth analysis detailing your home's value as well as a comparison with similar homes in the area
Home Values in the Area
Average Home Value in this Area
Purchase History
| Date | Buyer | Sale Price | Title Company |
|---|---|---|---|
| Rogers Lanson E | -- | None Available |
Source: Public Records
Tax History Compared to Growth
Tax History
| Year | Tax Paid | Tax Assessment Tax Assessment Total Assessment is a certain percentage of the fair market value that is determined by local assessors to be the total taxable value of land and additions on the property. | Land | Improvement |
|---|---|---|---|---|
| 2025 | $3,690 | $120,769 | $31,386 | $89,383 |
| 2024 | $3,690 | $118,402 | $30,771 | $87,631 |
| 2023 | $3,570 | $116,081 | $30,168 | $85,913 |
| 2022 | $3,511 | $113,806 | $29,577 | $84,229 |
| 2021 | $3,357 | $111,576 | $28,998 | $82,578 |
| 2020 | $2,699 | $110,433 | $28,701 | $81,732 |
| 2019 | $2,611 | $108,269 | $28,139 | $80,130 |
| 2018 | $2,564 | $106,147 | $27,588 | $78,559 |
| 2017 | $2,520 | $104,067 | $27,048 | $77,019 |
| 2016 | $2,401 | $102,027 | $26,518 | $75,509 |
| 2015 | $2,347 | $100,495 | $26,120 | $74,375 |
| 2014 | $1,830 | $98,528 | $25,609 | $72,919 |
Source: Public Records
Map
Nearby Homes
- 71 Hayes Ave
- 40 Cherry Crest Ln
- 510 Saddle Brook Dr Unit 122
- 510 Saddle Brook Dr Unit 322
- 5399 Garrison Cir
- 510 Saddlebrook Dr Unit 276
- 510 Saddlebrook Dr Unit 308
- 510 Saddlebrook Dr Unit 315
- 66 Cherry Ridge Ln
- 175 Page Mill Dr
- 5077 Bengal Dr
- 122 Jaybee Place
- 320 Battle Dance Dr
- 165 Blossom Hill Rd Unit 113
- 195 Blossom Hill Rd Unit 242
- 195 Blossom Hill Rd Unit 118
- 195 Blossom Hill Rd Unit 229
- 195 Blossom Hill Rd Unit 276
- 195 Blossom Hill Rd Unit 215
- 5117 Discovery Ave
- 5284 Running Bear Dr
- 5272 Running Bear Dr
- 5267 Broken Lance Ct
- 5273 Broken Lance Ct
- 5290 Running Bear Dr
- 5266 Running Bear Dr
- 5261 Broken Lance Ct
- 5279 Broken Lance Ct
- 5277 Running Bear Dr
- 5271 Running Bear Dr
- 5296 Running Bear Dr
- 5283 Running Bear Dr
- 5260 Running Bear Dr
- 5255 Broken Lance Ct
- 5265 Running Bear Dr
- 5289 Running Bear Dr
- 5285 Broken Lance Ct
- 5259 Running Bear Dr
- 5254 Running Bear Dr
- 5295 Running Bear Dr