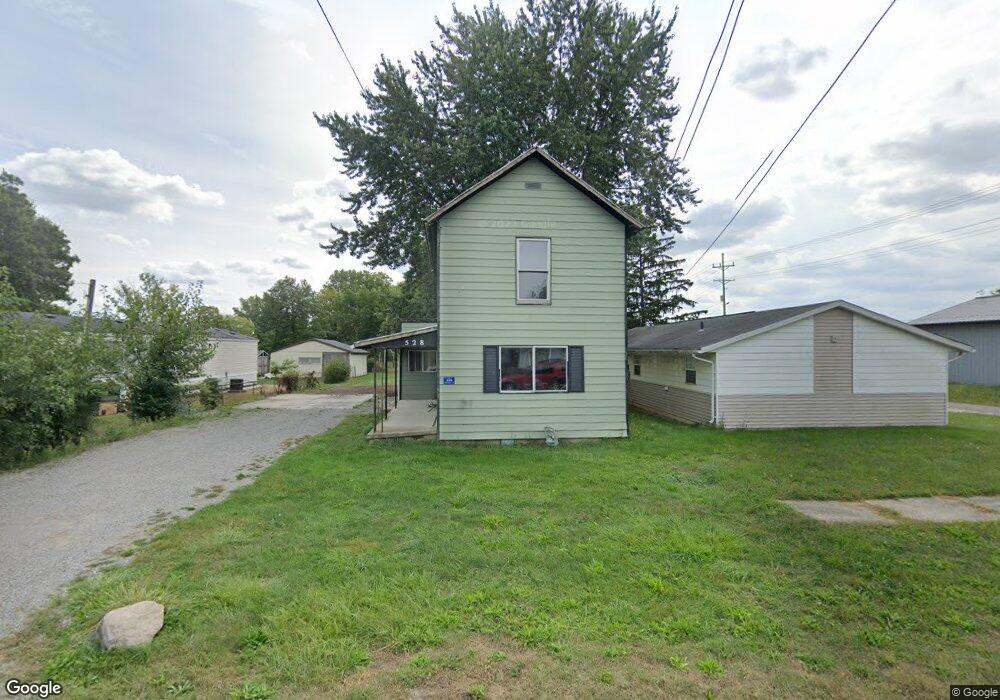
528 Barnett St Findlay, OH 45840
Estimated Value: $100,000 - $140,000
3
Beds
1
Bath
1,204
Sq Ft
$104/Sq Ft
Est. Value
About This Home
This home is located at 528 Barnett St, Findlay, OH 45840 and is currently estimated at $124,748, approximately $103 per square foot. 528 Barnett St is a home located in Hancock County with nearby schools including Whittier Primary School, Bigelow Hill Elementary School, and Glenwood Middle School.
Ownership History
Date
Name
Owned For
Owner Type
Purchase Details
Closed on
May 13, 2016
Sold by
Tong Bobbi A and Beach Bobbi A
Bought by
Performance R & D Llc
Current Estimated Value
Home Financials for this Owner
Home Financials are based on the most recent Mortgage that was taken out on this home.
Original Mortgage
$18,000
Outstanding Balance
$14,353
Interest Rate
3.71%
Mortgage Type
Purchase Money Mortgage
Estimated Equity
$110,395
Purchase Details
Closed on
Jul 1, 2002
Sold by
Hunter Ben E
Bought by
Beach Bobbi A
Home Financials for this Owner
Home Financials are based on the most recent Mortgage that was taken out on this home.
Original Mortgage
$52,500
Interest Rate
6.93%
Mortgage Type
New Conventional
Create a Home Valuation Report for This Property
The Home Valuation Report is an in-depth analysis detailing your home's value as well as a comparison with similar homes in the area
Home Values in the Area
Average Home Value in this Area
Purchase History
| Date | Buyer | Sale Price | Title Company |
|---|---|---|---|
| Performance R & D Llc | $45,000 | Whitman Title Security | |
| Beach Bobbi A | $65,700 | -- |
Source: Public Records
Mortgage History
| Date | Status | Borrower | Loan Amount |
|---|---|---|---|
| Open | Performance R & D Llc | $18,000 | |
| Previous Owner | Beach Bobbi A | $52,500 |
Source: Public Records
Tax History Compared to Growth
Tax History
| Year | Tax Paid | Tax Assessment Tax Assessment Total Assessment is a certain percentage of the fair market value that is determined by local assessors to be the total taxable value of land and additions on the property. | Land | Improvement |
|---|---|---|---|---|
| 2024 | $1,039 | $28,510 | $4,380 | $24,130 |
| 2023 | $1,041 | $28,510 | $4,380 | $24,130 |
| 2022 | $1,037 | $28,510 | $4,380 | $24,130 |
| 2021 | $857 | $20,510 | $4,590 | $15,920 |
| 2020 | $857 | $20,510 | $4,590 | $15,920 |
| 2019 | $840 | $20,510 | $4,590 | $15,920 |
| 2018 | $835 | $18,700 | $2,780 | $15,920 |
| 2017 | $400 | $17,910 | $2,780 | $15,130 |
| 2016 | $801 | $17,910 | $2,780 | $15,130 |
| 2015 | $675 | $15,430 | $2,220 | $13,210 |
| 2014 | $675 | $15,430 | $2,220 | $13,210 |
| 2012 | $651 | $14,740 | $3,150 | $11,590 |
Source: Public Records
Map
Nearby Homes
- 524 Defiance Ave
- 1005 Broad Ave
- 224 Defiance Ave
- 533 Davis St
- 706 N Cory St
- 604 Davis St
- 512 N Cory St
- 210 Western Ave
- 115 George St
- 207 Ash Ave
- 407 Washington St
- 0 Canadian Way Unit 20253551
- 0 Canadian Way Unit 6135400
- 213 Cherry St
- 915 W Main Cross St
- 206 Midland Ave
- 410 Monroe Ave
- 405 Clifton Ave
- 230 Midland Ave
- 247 Crystal Ave