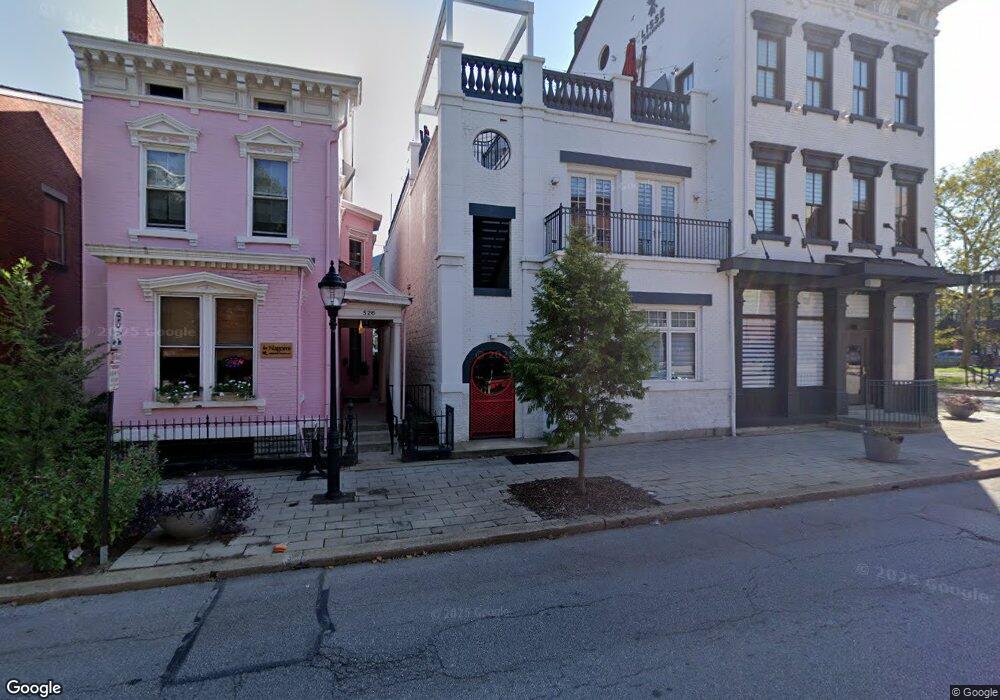
528 Main St Covington, KY 41011
Downtown Covington NeighborhoodEstimated Value: $717,888
Studio
--
Bath
9,762
Sq Ft
$74/Sq Ft
Est. Value
About This Home
This home is located at 528 Main St, Covington, KY 41011 and is currently estimated at $717,888, approximately $73 per square foot. 528 Main St is a home located in Kenton County with nearby schools including Holmes High School, Prince of Peace School, and Saint Augustine Catholic School.
Ownership History
Date
Name
Owned For
Owner Type
Purchase Details
Closed on
Feb 24, 2015
Sold by
Latin Garden Properties Llc
Bought by
530 Mainpro Llc
Current Estimated Value
Home Financials for this Owner
Home Financials are based on the most recent Mortgage that was taken out on this home.
Original Mortgage
$339,000
Interest Rate
3.75%
Mortgage Type
Future Advance Clause Open End Mortgage
Purchase Details
Closed on
Apr 29, 1996
Sold by
Matracia Michael
Bought by
Latin Garden Properties
Home Financials for this Owner
Home Financials are based on the most recent Mortgage that was taken out on this home.
Original Mortgage
$108,750
Interest Rate
7.8%
Mortgage Type
Commercial
Create a Home Valuation Report for This Property
The Home Valuation Report is an in-depth analysis detailing your home's value as well as a comparison with similar homes in the area
Home Values in the Area
Average Home Value in this Area
Purchase History
| Date | Buyer | Sale Price | Title Company |
|---|---|---|---|
| 530 Mainpro Llc | $345,000 | None Available | |
| Latin Garden Properties | $147,500 | -- |
Source: Public Records
Mortgage History
| Date | Status | Borrower | Loan Amount |
|---|---|---|---|
| Closed | 530 Mainpro Llc | $339,000 | |
| Previous Owner | Latin Garden Properties | $108,750 |
Source: Public Records
Tax History
| Year | Tax Paid | Tax Assessment Tax Assessment Total Assessment is a certain percentage of the fair market value that is determined by local assessors to be the total taxable value of land and additions on the property. | Land | Improvement |
|---|---|---|---|---|
| 2025 | $13,332 | $1,006,200 | $90,000 | $916,200 |
| 2024 | $13,232 | $1,006,200 | $90,000 | $916,200 |
| 2023 | $13,403 | $1,006,200 | $90,000 | $916,200 |
| 2022 | $13,461 | $1,006,200 | $90,000 | $916,200 |
| 2021 | $15,478 | $1,006,200 | $90,000 | $916,200 |
| 2020 | $15,399 | $1,006,200 | $90,000 | $916,200 |
| 2019 | $15,573 | $1,006,200 | $90,000 | $916,200 |
| 2018 | $15,898 | $1,006,200 | $90,000 | $916,200 |
| 2017 | $15,662 | $976,200 | $60,000 | $916,200 |
| 2015 | $10,873 | $385,000 | $60,000 | $325,000 |
| 2014 | $10,896 | $563,000 | $30,000 | $533,000 |
Source: Public Records
Map
Nearby Homes
- 328 W 6th St
- 501 Johnson St
- 346 W 9th St
- 138 W Pike St
- 515 W 9th St
- 130 W 4th St
- 128 W 4th St
- 126 W 4th St
- 124 W 4th St
- 652 Western Ave
- 1025 Banklick St
- 848 Western Ave Unit Lot 2
- 844 Western Ave Unit Lot 4
- 852 Western Ave Unit Lot 1
- 846 Western Ave Unit Lot 3
- 501 Western Ave
- 728 Western Ave
- 1212-1234 W Pike St
- 656 W Pike St
- 664 W Pike St