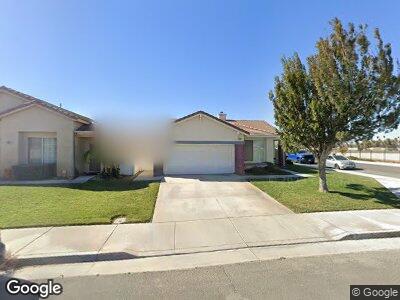
5287 Manhart Cir Riverside, CA 92509
Estimated Value: $544,407 - $597,000
3
Beds
2
Baths
1,304
Sq Ft
$438/Sq Ft
Est. Value
About This Home
This home is located at 5287 Manhart Cir, Riverside, CA 92509 and is currently estimated at $570,602, approximately $437 per square foot. 5287 Manhart Cir is a home located in Riverside County with nearby schools including Peralta Elementary, Mission Middle School, and Rubidoux High School.
Ownership History
Date
Name
Owned For
Owner Type
Purchase Details
Closed on
Feb 23, 2007
Sold by
Clark Timothy I and Littlejohn Clark Lois D
Bought by
Clark Timothy I and Littlejohn Clark Lois D
Current Estimated Value
Purchase Details
Closed on
Jul 2, 2004
Sold by
Delatorre April D
Bought by
Clark Timothy and Clark Lois Littlejohn
Home Financials for this Owner
Home Financials are based on the most recent Mortgage that was taken out on this home.
Original Mortgage
$165,000
Interest Rate
6.24%
Mortgage Type
Purchase Money Mortgage
Purchase Details
Closed on
Mar 27, 2003
Sold by
Delatorre Pedro
Bought by
Delatorre April D
Purchase Details
Closed on
Jul 6, 1999
Sold by
The Forecast Group Lp
Bought by
Spencer April D
Home Financials for this Owner
Home Financials are based on the most recent Mortgage that was taken out on this home.
Original Mortgage
$123,810
Interest Rate
7.64%
Mortgage Type
FHA
Create a Home Valuation Report for This Property
The Home Valuation Report is an in-depth analysis detailing your home's value as well as a comparison with similar homes in the area
Home Values in the Area
Average Home Value in this Area
Purchase History
| Date | Buyer | Sale Price | Title Company |
|---|---|---|---|
| Clark Timothy I | -- | None Available | |
| Clark Timothy | $265,000 | Fidelity National Title Ins | |
| Delatorre April D | -- | American Title Co | |
| Delatorre April D | -- | American Title | |
| Spencer April D | $124,000 | Orange Coast Title |
Source: Public Records
Mortgage History
| Date | Status | Borrower | Loan Amount |
|---|---|---|---|
| Previous Owner | Clark Timothy | $165,000 | |
| Previous Owner | Spencer April D | $9,076 | |
| Previous Owner | Spencer April D | $123,810 |
Source: Public Records
Tax History Compared to Growth
Tax History
| Year | Tax Paid | Tax Assessment Tax Assessment Total Assessment is a certain percentage of the fair market value that is determined by local assessors to be the total taxable value of land and additions on the property. | Land | Improvement |
|---|---|---|---|---|
| 2023 | $4,019 | $355,020 | $133,966 | $221,054 |
| 2022 | $3,935 | $348,060 | $131,340 | $216,720 |
| 2021 | $3,914 | $341,236 | $128,765 | $212,471 |
| 2020 | $3,877 | $337,738 | $127,445 | $210,293 |
| 2019 | $3,800 | $331,117 | $124,947 | $206,170 |
| 2018 | $3,677 | $324,626 | $122,498 | $202,128 |
| 2017 | $3,547 | $310,000 | $117,000 | $193,000 |
| 2016 | $3,342 | $290,000 | $109,000 | $181,000 |
| 2015 | $3,302 | $253,000 | $95,000 | $158,000 |
| 2014 | $3,033 | $231,000 | $87,000 | $144,000 |
Source: Public Records
Map
Nearby Homes
- 5166 Contay Way
- 5374 Mission Rock Way
- 4258 Hidatsa St
- 3825 Crestmore Rd Unit 426
- 3825 Crestmore Rd Unit 450
- 3825 Crestmore Rd Unit 412
- 3883 Wallace St
- 5244 Holstein Way
- 5442 Mission Blvd
- 3911 Pontiac Ave
- 5746 Tilton Ave
- 4899 Glenwood Dr
- 5154 34th St
- 5754 Tilton Ave
- 0 Mission Blvd Unit PW24252396
- 0 Mission Blvd Unit IV23139894
- 0 42nd St
- 5683 Green Pasture Rd
- 5479 34th St
- 5479 34th St Unit 2
- 5287 Manhart Cir
- 5277 Manhart Cir
- 4362 Propeller Ct
- 5267 Manhart Cir
- 4370 Propeller Ct
- 4346 Propeller Ct
- 5257 Manhart Cir
- 5284 Manhart Cir
- 5274 Manhart Cir
- 4378 Propeller Ct
- 5264 Manhart Cir
- 4386 Propeller Ct
- 5247 Manhart Cir
- 4341 Propeller Ct
- 4349 Propeller Ct
- 5244 Manhart Cir
- 5276 Mission Rock Way
- 4357 Propeller Ct
- 4365 Propeller Ct
- 5237 Manhart Cir