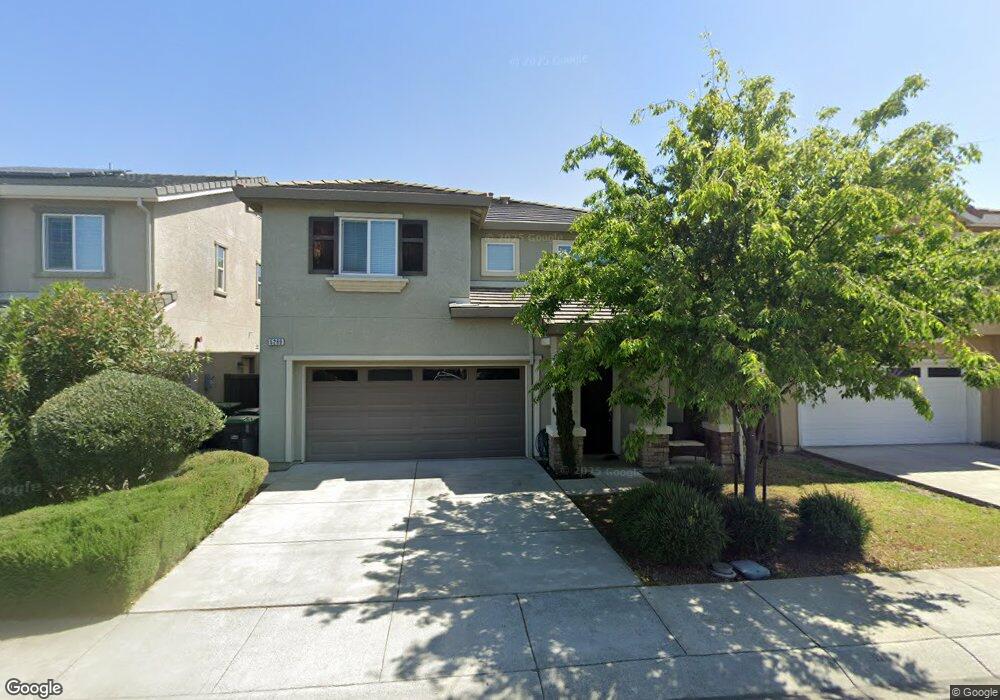
5289 Gramercy Cir Fairfield, CA 94533
Estimated Value: $587,152 - $644,000
3
Beds
3
Baths
1,950
Sq Ft
$321/Sq Ft
Est. Value
About This Home
This home is located at 5289 Gramercy Cir, Fairfield, CA 94533 and is currently estimated at $625,288, approximately $320 per square foot. 5289 Gramercy Cir is a home located in Solano County with nearby schools including Center Elementary School, Golden West Middle School, and Vanden High School.
Ownership History
Date
Name
Owned For
Owner Type
Purchase Details
Closed on
Aug 25, 2022
Sold by
Sun Yang and Sun Hongtao
Bought by
Xie-Sun Living Trust and Xie
Current Estimated Value
Purchase Details
Closed on
Apr 11, 2016
Sold by
Hicks Rinnzell and Hicks Candace Marie
Bought by
Sun Yang and Xie Hongtao
Home Financials for this Owner
Home Financials are based on the most recent Mortgage that was taken out on this home.
Original Mortgage
$312,375
Interest Rate
3.64%
Mortgage Type
New Conventional
Purchase Details
Closed on
Oct 29, 2014
Sold by
Citation Northern Inc
Bought by
Hicks Rinnzell R and Hicks Candace M
Home Financials for this Owner
Home Financials are based on the most recent Mortgage that was taken out on this home.
Original Mortgage
$371,321
Interest Rate
4.16%
Mortgage Type
New Conventional
Purchase Details
Closed on
May 7, 2014
Sold by
Citation Northern Inc
Bought by
Citation Northern Inc
Create a Home Valuation Report for This Property
The Home Valuation Report is an in-depth analysis detailing your home's value as well as a comparison with similar homes in the area
Home Values in the Area
Average Home Value in this Area
Purchase History
| Date | Buyer | Sale Price | Title Company |
|---|---|---|---|
| Xie-Sun Living Trust | -- | None Listed On Document | |
| Sun Yang | $416,500 | North American Title Co Inc | |
| Hicks Rinnzell R | $391,000 | First American Title Company | |
| Citation Northern Inc | -- | First American Title |
Source: Public Records
Mortgage History
| Date | Status | Borrower | Loan Amount |
|---|---|---|---|
| Previous Owner | Sun Yang | $312,375 | |
| Previous Owner | Hicks Rinnzell R | $371,321 |
Source: Public Records
Tax History Compared to Growth
Tax History
| Year | Tax Paid | Tax Assessment Tax Assessment Total Assessment is a certain percentage of the fair market value that is determined by local assessors to be the total taxable value of land and additions on the property. | Land | Improvement |
|---|---|---|---|---|
| 2025 | $7,674 | $493,044 | $147,971 | $345,073 |
| 2024 | $7,674 | $483,377 | $145,070 | $338,307 |
| 2023 | $7,528 | $473,900 | $142,226 | $331,674 |
| 2022 | $7,303 | $464,609 | $139,439 | $325,170 |
| 2021 | $7,168 | $455,500 | $136,705 | $318,795 |
| 2020 | $7,031 | $450,831 | $135,304 | $315,527 |
| 2019 | $6,919 | $441,992 | $132,651 | $309,341 |
| 2018 | $6,808 | $433,326 | $130,050 | $303,276 |
| 2017 | $6,609 | $424,830 | $127,500 | $297,330 |
| 2016 | $6,173 | $391,581 | $101,525 | $290,056 |
| 2015 | $6,067 | $385,700 | $100,000 | $285,700 |
| 2014 | $3,358 | $128,709 | $128,709 | $0 |
Source: Public Records
Map
Nearby Homes
- 5311 Gramercy Cir
- 5348 Gramercy Cir
- 2746 Gracie Place
- 5383 Elan Dr
- 2472 Shorey Way
- 2541 Rowe Dr
- 6012 Big Sky Dr
- 6008 Big Sky Dr
- 6004 Big Sky Dr
- 5291 Finkas Ln
- 5299 Elmquest Ct
- 5987 Big Sky Dr
- 2438 Sheldon Dr
- 2429 Artisan Way
- Plan 3 at Glisten at One Lake - Glisten At One Lake
- Plan 1 at Splash at One Lake
- Plan 2 at Swirl at One Lake
- Plan 1 at Glisten at One Lake - Glisten At One Lake
- Plan 2 at Splash at One Lake
- Plan 2 at Glisten at One Lake - Glisten At One Lake
- 5291 Gramercy Cir
- 5287 Gramercy Cir
- 5293 Gramercy Cir
- 5285 Gramercy Cir
- 5283 Gramercy Cir
- 5295 Gramercy Cir
- 5290 Gramercy Cir
- 5286 Gramercy Cir
- 5288 Gramercy Cir
- 5284 Gramercy Cir
- 5292 Gramercy Cir
- 5297 Gramercy Cir
- 5281 Gramercy Cir
- 5282 Gramercy Cir
- 5344 Gramercy Cir
- 5328 Gramercy Cir
- 5336 Gramercy Cir
- 5299 Gramercy Cir
- 5279 Gramercy Cir
- 5296 Gramercy Cir