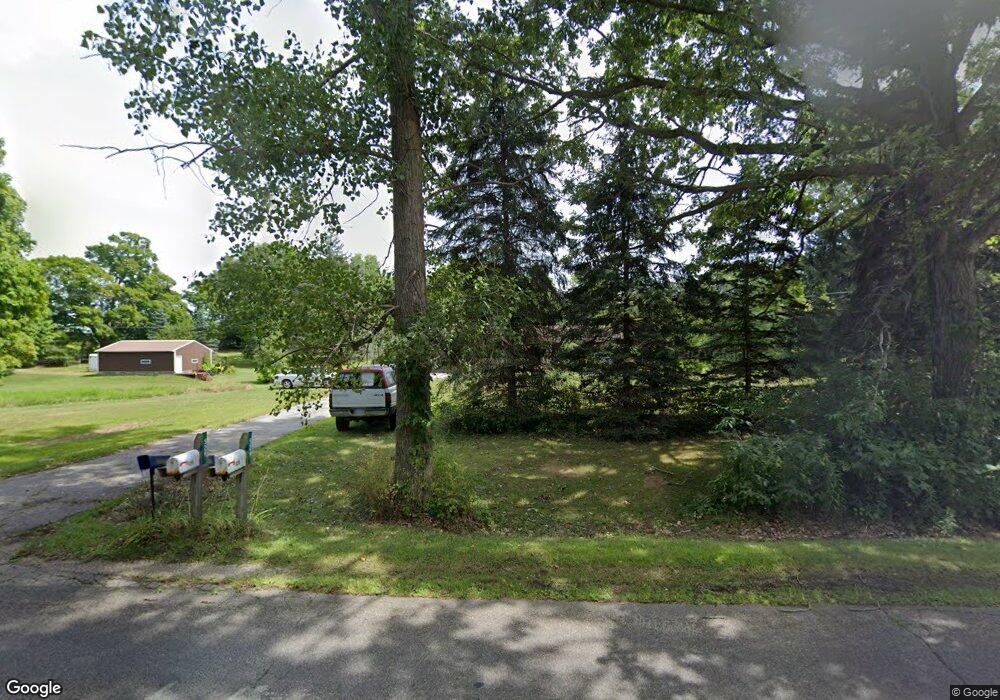
529 S Waverly Rd Eaton Rapids, MI 48827
Estimated Value: $260,000 - $350,000
3
Beds
2
Baths
1,144
Sq Ft
$261/Sq Ft
Est. Value
About This Home
This home is located at 529 S Waverly Rd, Eaton Rapids, MI 48827 and is currently estimated at $298,096, approximately $260 per square foot. 529 S Waverly Rd is a home located in Ingham County with nearby schools including Lockwood Elementary School, Greyhound Intermediate School, and Eaton Rapids Middle School.
Ownership History
Date
Name
Owned For
Owner Type
Purchase Details
Closed on
Jul 23, 2002
Sold by
Burgess Bret B and Burgess Theresa M
Bought by
Stanton James A and Stanton Molly J
Current Estimated Value
Home Financials for this Owner
Home Financials are based on the most recent Mortgage that was taken out on this home.
Original Mortgage
$125,600
Outstanding Balance
$52,904
Interest Rate
6.62%
Estimated Equity
$245,192
Purchase Details
Closed on
Dec 20, 1996
Sold by
Ohlemacher Matthew N and Ohlemacher Kimberl
Bought by
Burgess Bret B
Purchase Details
Closed on
Apr 15, 1994
Bought by
Ohlemacher
Purchase Details
Closed on
Sep 1, 1986
Bought by
Vos
Create a Home Valuation Report for This Property
The Home Valuation Report is an in-depth analysis detailing your home's value as well as a comparison with similar homes in the area
Home Values in the Area
Average Home Value in this Area
Purchase History
| Date | Buyer | Sale Price | Title Company |
|---|---|---|---|
| Stanton James A | $157,000 | Midstate Title Company | |
| Burgess Bret B | $104,000 | -- | |
| Ohlemacher | $98,900 | -- | |
| Vos | $63,500 | -- |
Source: Public Records
Mortgage History
| Date | Status | Borrower | Loan Amount |
|---|---|---|---|
| Open | Stanton James A | $125,600 | |
| Closed | Stanton James A | $23,550 |
Source: Public Records
Tax History Compared to Growth
Tax History
| Year | Tax Paid | Tax Assessment Tax Assessment Total Assessment is a certain percentage of the fair market value that is determined by local assessors to be the total taxable value of land and additions on the property. | Land | Improvement |
|---|---|---|---|---|
| 2025 | $3,319 | $138,200 | $22,100 | $116,100 |
| 2024 | $2,980 | $131,800 | $21,600 | $110,200 |
| 2023 | $2,980 | $120,100 | $14,200 | $105,900 |
| 2022 | $2,838 | $104,700 | $20,400 | $84,300 |
| 2021 | $2,804 | $98,200 | $0 | $98,200 |
| 2020 | $2,126 | $91,400 | $17,100 | $74,300 |
| 2019 | $2,087 | $92,500 | $18,000 | $74,500 |
| 2018 | $2,611 | $86,400 | $18,000 | $68,400 |
| 2017 | $2,459 | $86,400 | $18,000 | $68,400 |
| 2016 | -- | $81,900 | $18,000 | $63,900 |
| 2015 | -- | $79,200 | $36,020 | $43,180 |
| 2014 | -- | $75,100 | $36,020 | $39,080 |
Source: Public Records
Map
Nearby Homes
- 6401 Curtice Rd
- 119 Branson Bay Dr
- 11249 Columbia Hwy
- 5485 W Columbia Rd
- 525 Grovenburg Rd
- 1822 S Michigan Rd
- 650 Waverly Rd
- 2318 Arch Rd
- 1692 S Smith Rd
- 896 Waverly Rd
- Parcel H Dawn Marie Ln
- Parcel B Dawn Marie Ln
- 372 S Eifert Rd
- 5906 W Barnes Rd
- 4939 W Columbia Rd
- 2093 Gale Rd
- 2009 S Canal Rd
- 2670 S Michigan Rd
- 6290 Quail Ridge Ln Unit 13
- 6042 W Plains Rd
- 6465 Curtice Rd
- 6480 Curtice Rd
- 574 S Waverly Rd
- 6435 Curtice Rd
- 472 S Waverly Rd
- 472 S Waverly Rd
- 600 S Waverly Rd
- 456 S Waverly Rd
- 520 S Waverly Rd
- 599 S Waverly Rd
- 540 S Waverly Rd
- 550 S Waverly Rd
- 440 S Waverly Rd
- 440 S Waverly Rd Unit R1
- 622 S Waverly Rd
- 628 S Waverly Rd
- 554 S Waverly Rd
- 617 S Waverly Rd
- 655 S Waverly Rd
- 6383 Curtice Rd