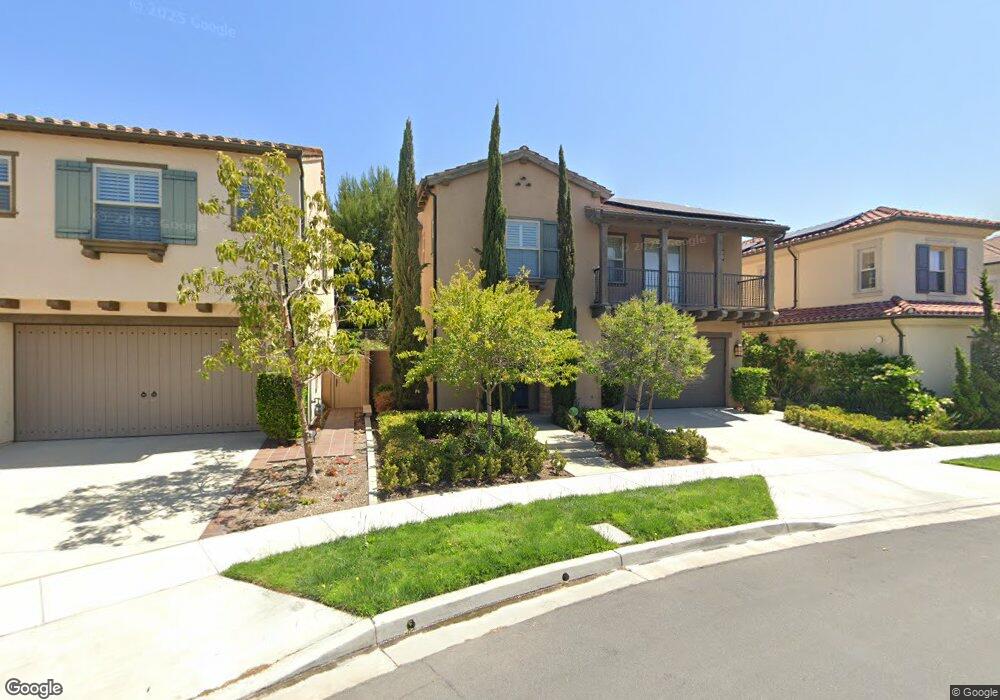
53 Crestwick Irvine, CA 92620
Woodbury and Stonegate NeighborhoodEstimated Value: $2,178,000 - $2,565,000
3
Beds
3
Baths
2,417
Sq Ft
$959/Sq Ft
Est. Value
About This Home
This home is located at 53 Crestwick, Irvine, CA 92620 and is currently estimated at $2,317,694, approximately $958 per square foot. 53 Crestwick is a home with nearby schools including Stonegate Elementary School, Sierra Vista Middle School, and Northwood High School.
Ownership History
Date
Name
Owned For
Owner Type
Purchase Details
Closed on
May 16, 2016
Sold by
Chun Ricky Kuan Wu and Chieng Fidelia Meichu
Bought by
Chun Ricky K W and Chun Fidelia M
Current Estimated Value
Purchase Details
Closed on
Jan 22, 2015
Sold by
Irvine Pacific Lp
Bought by
Chun Ricky Kuan Wu and Chieng Fidelia Meichu
Home Financials for this Owner
Home Financials are based on the most recent Mortgage that was taken out on this home.
Original Mortgage
$56,000
Interest Rate
3.54%
Mortgage Type
Credit Line Revolving
Create a Home Valuation Report for This Property
The Home Valuation Report is an in-depth analysis detailing your home's value as well as a comparison with similar homes in the area
Home Values in the Area
Average Home Value in this Area
Purchase History
| Date | Buyer | Sale Price | Title Company |
|---|---|---|---|
| Chun Ricky K W | -- | Accommodation | |
| Chun Ricky Kuan Wu | $974,000 | First American Title Company | |
| Irvine Pacific Lp | -- | First American Title Company |
Source: Public Records
Mortgage History
| Date | Status | Borrower | Loan Amount |
|---|---|---|---|
| Previous Owner | Irvine Pacific Lp | $56,000 | |
| Previous Owner | Chun Ricky Kuan Wu | $625,500 |
Source: Public Records
Tax History
| Year | Tax Paid | Tax Assessment Tax Assessment Total Assessment is a certain percentage of the fair market value that is determined by local assessors to be the total taxable value of land and additions on the property. | Land | Improvement |
|---|---|---|---|---|
| 2025 | $15,644 | $1,170,131 | $686,022 | $484,109 |
| 2024 | $15,644 | $1,147,188 | $672,571 | $474,617 |
| 2023 | $15,386 | $1,124,695 | $659,384 | $465,311 |
| 2022 | $15,160 | $1,102,643 | $646,455 | $456,188 |
| 2021 | $14,931 | $1,081,023 | $633,779 | $447,244 |
| 2020 | $15,311 | $1,069,939 | $627,280 | $442,659 |
| 2019 | $15,255 | $1,048,960 | $614,980 | $433,980 |
| 2018 | $15,136 | $1,028,393 | $602,922 | $425,471 |
| 2017 | $14,921 | $1,008,229 | $591,100 | $417,129 |
| 2016 | $14,476 | $988,460 | $579,510 | $408,950 |
| 2015 | $7,921 | $343,871 | $1,488 | $342,383 |
| 2014 | $664 | $1,459 | $1,459 | $0 |
Source: Public Records
Map
Nearby Homes
- 68 Quentin
- 97 Decker
- 52 Cummings
- 67 Runner
- 100 Omar
- 160 Parkwood
- 109 Sugar Cane
- 230 Shelbourne
- 120 Gemstone
- 119 Alumroot
- 105 Landover
- 106 Cordial
- 126 Paxton
- 51 Dunmore
- 117 Reflection
- 5200 Irvine Blvd Unit 497
- 5200 Irvine Blvd
- 5200 Irvine Blvd Unit 123
- 5200 Irvine Blvd Unit 256
- 5200 Irvine Blvd Unit 254
Your Personal Tour Guide
Ask me questions while you tour the home.