Estimated Value: $78,000 - $163,000
Studio
--
Bath
936
Sq Ft
$135/Sq Ft
Est. Value
About This Home
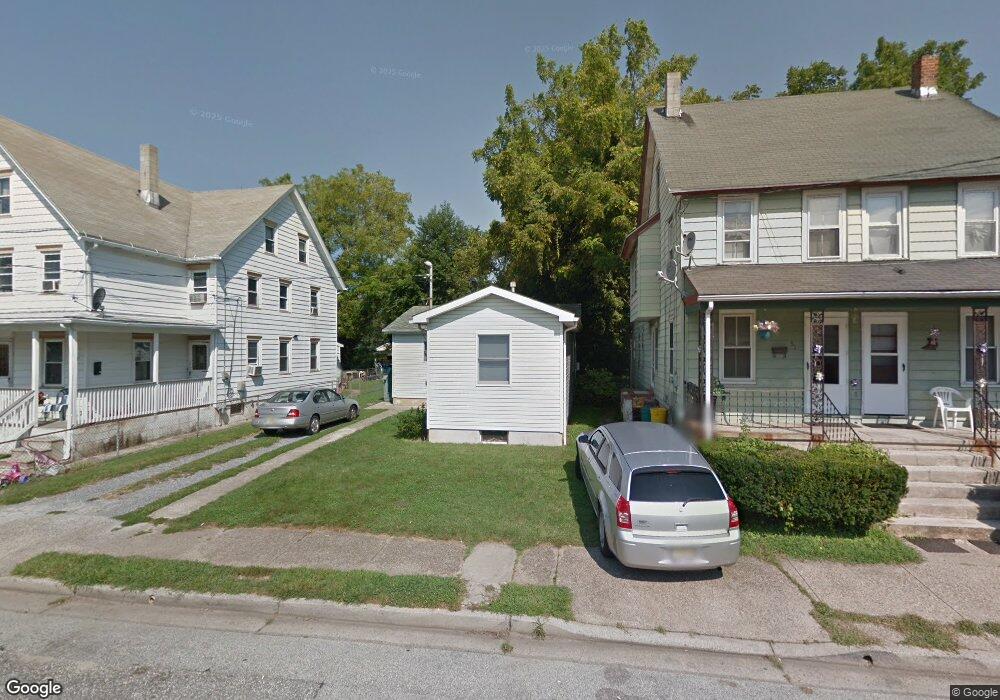
This home is located at 53 Elm St, Salem, NJ 08079 and is currently estimated at $126,186, approximately $134 per square foot. 53 Elm St is a home located in Salem County with nearby schools including John Fenwick Elementary School, Salem Middle School, and Salem High School.
Ownership History
Date
Name
Owned For
Owner Type
Purchase Details
Closed on
Jun 8, 2023
Sold by
Brown Carl C
Bought by
Archer Rentals Llc
Current Estimated Value
Home Financials for this Owner
Home Financials are based on the most recent Mortgage that was taken out on this home.
Original Mortgage
$43,400
Outstanding Balance
$39,004
Interest Rate
5.71%
Mortgage Type
Seller Take Back
Estimated Equity
$87,182
Purchase Details
Closed on
Mar 9, 2000
Sold by
Jackson Helen F and Ogletree Helen
Bought by
Brown Carl C
Create a Home Valuation Report for This Property
The Home Valuation Report is an in-depth analysis detailing your home's value as well as a comparison with similar homes in the area
Home Values in the Area
Average Home Value in this Area
Purchase History
| Date | Buyer | Sale Price | Title Company |
|---|---|---|---|
| Archer Rentals Llc | -- | Salem Oak Title | |
| Archer Rentals Llc | -- | Salem Oak Title | |
| Brown Carl C | $2,000 | Salem Oak Title Agency Inc |
Source: Public Records
Mortgage History
| Date | Status | Borrower | Loan Amount |
|---|---|---|---|
| Open | Archer Rentals Llc | $43,400 | |
| Closed | Archer Rentals Llc | $43,400 |
Source: Public Records
Tax History
| Year | Tax Paid | Tax Assessment Tax Assessment Total Assessment is a certain percentage of the fair market value that is determined by local assessors to be the total taxable value of land and additions on the property. | Land | Improvement |
|---|---|---|---|---|
| 2025 | $3,568 | $43,400 | $9,500 | $33,900 |
| 2024 | $3,412 | $43,400 | $9,500 | $33,900 |
Source: Public Records
Map
Nearby Homes
Your Personal Tour Guide
Ask me questions while you tour the home.