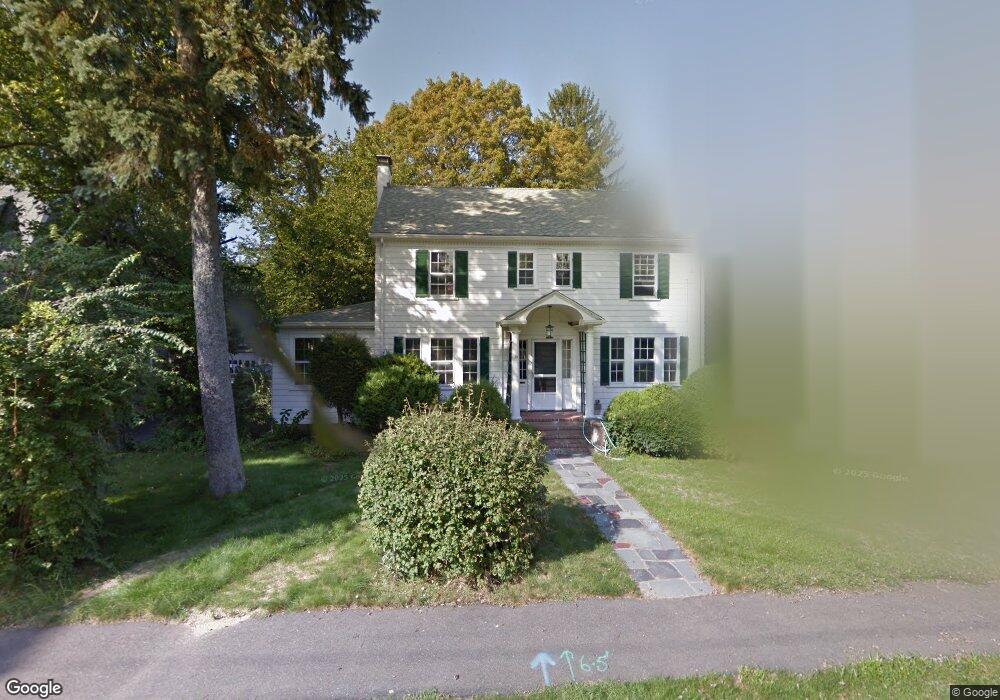
53 Parkinson St Needham, MA 02492
Estimated Value: $1,436,000 - $2,082,000
4
Beds
2
Baths
1,835
Sq Ft
$930/Sq Ft
Est. Value
About This Home
This home is located at 53 Parkinson St, Needham, MA 02492 and is currently estimated at $1,706,202, approximately $929 per square foot. 53 Parkinson St is a home located in Norfolk County with nearby schools including Mitchell Elementary School, High Rock Middle School, and Pollard Middle School.
Ownership History
Date
Name
Owned For
Owner Type
Purchase Details
Closed on
Sep 28, 2015
Sold by
Peters Robert T and Peters Karen W
Bought by
Karen Weiburg Peters R
Current Estimated Value
Purchase Details
Closed on
Dec 17, 2010
Sold by
Carey Elizabeth N and Loud Mary C
Bought by
Peters Robert T and Weiburg-Peters Karen
Home Financials for this Owner
Home Financials are based on the most recent Mortgage that was taken out on this home.
Original Mortgage
$523,750
Interest Rate
4.23%
Mortgage Type
Purchase Money Mortgage
Create a Home Valuation Report for This Property
The Home Valuation Report is an in-depth analysis detailing your home's value as well as a comparison with similar homes in the area
Home Values in the Area
Average Home Value in this Area
Purchase History
| Date | Buyer | Sale Price | Title Company |
|---|---|---|---|
| Karen Weiburg Peters R | -- | -- | |
| Peters Robert T | $694,000 | -- |
Source: Public Records
Mortgage History
| Date | Status | Borrower | Loan Amount |
|---|---|---|---|
| Previous Owner | Peters Robert T | $523,750 |
Source: Public Records
Tax History Compared to Growth
Tax History
| Year | Tax Paid | Tax Assessment Tax Assessment Total Assessment is a certain percentage of the fair market value that is determined by local assessors to be the total taxable value of land and additions on the property. | Land | Improvement |
|---|---|---|---|---|
| 2025 | $14,193 | $1,339,000 | $800,000 | $539,000 |
| 2024 | $14,284 | $1,140,900 | $581,000 | $559,900 |
| 2023 | $14,337 | $1,099,500 | $581,000 | $518,500 |
| 2022 | $13,906 | $1,040,100 | $538,000 | $502,100 |
| 2021 | $13,553 | $1,040,100 | $538,000 | $502,100 |
| 2020 | $13,298 | $1,064,700 | $537,900 | $526,800 |
| 2019 | $11,728 | $946,600 | $489,000 | $457,600 |
| 2018 | $11,246 | $946,600 | $489,000 | $457,600 |
| 2017 | $10,623 | $893,400 | $489,000 | $404,400 |
| 2016 | $10,359 | $897,700 | $489,000 | $408,700 |
| 2015 | $10,135 | $897,700 | $489,000 | $408,700 |
| 2014 | $9,132 | $784,500 | $425,200 | $359,300 |
Source: Public Records
Map
Nearby Homes
- 40 Otis St Unit L
- 42 Otis St Unit R
- 154 Warren St
- 26 Pinewood Rd
- 62 Washington Ave
- 556 Webster St
- 71 School St
- 190 Brookline St
- 233 Warren St
- 332 Hillcrest Rd
- 1011 Webster St
- 317 Dedham Ave
- 445 Hillside Ave
- 3 Crescent Rd
- 247 Broad Meadow Rd
- 34 Pershing Rd
- 23 Cheney St
- 400 Hunnewell St Unit 103
- 379 Hunnewell St Unit 379
- 9 Jayne Rd
- 57 Parkinson St
- 47 Parkinson St
- 325 Manning St
- 63 Parkinson St
- 114 Powers St
- 347 Manning St
- 102 Powers St
- 120 Powers St
- 60 Parkinson St
- 69 Parkinson St
- 351 Manning St
- 33 Parkinson St
- 64 Parkinson St
- 77 Parkinson St
- 326 Manning St
- 126 Powers St
- 728 Webster St
- 70 Parkinson St
- 34 Parkinson St Unit 34
- 348 Manning St