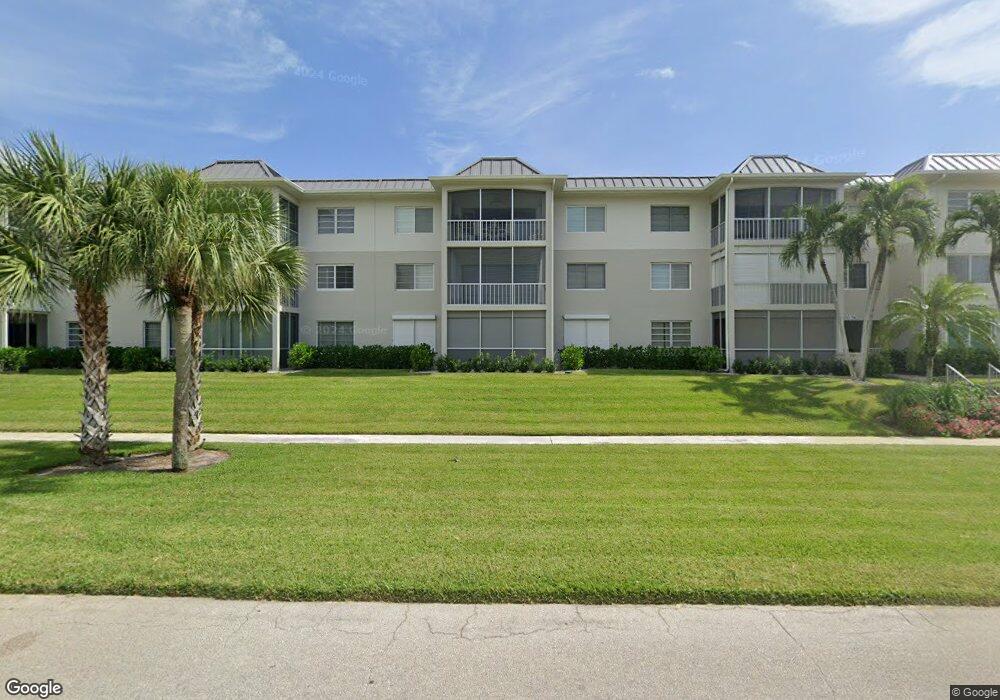
530 12th Ave S Unit 530 Naples, FL 34102
Old Naples NeighborhoodEstimated Value: $582,000 - $689,000
--
Bed
--
Bath
912
Sq Ft
$705/Sq Ft
Est. Value
About This Home
This home is located at 530 12th Ave S Unit 530, Naples, FL 34102 and is currently estimated at $642,793, approximately $704 per square foot. 530 12th Ave S Unit 530 is a home located in Collier County with nearby schools including Lake Park Elementary School, Naples High School, and Gulfview Middle School.
Ownership History
Date
Name
Owned For
Owner Type
Purchase Details
Closed on
Oct 23, 2019
Sold by
Gouse Ronald P and Gouse Cecelia A
Bought by
Gouse Ronald P and Gouse Cecelia A
Current Estimated Value
Purchase Details
Closed on
Dec 19, 2002
Sold by
Gouse Ronald P and Gouse Cecelia A
Bought by
Gouse Ronald P
Purchase Details
Closed on
Mar 22, 2002
Sold by
Arnold Marcia R
Bought by
Gouse Ronald P and Gouse Cecelia A
Purchase Details
Closed on
Jun 1, 1998
Sold by
Schoolwerth Anton C and Schoolwerth Judith E
Bought by
Fleet Tr & Investment Services Inc and Rachel M Arnold Rev Tr Agreement
Purchase Details
Closed on
Jul 28, 1994
Sold by
Pierson James B and Pierson Roseann C
Bought by
Schoolwerth Anton C and Schoolwerth Judith E
Home Financials for this Owner
Home Financials are based on the most recent Mortgage that was taken out on this home.
Original Mortgage
$66,000
Interest Rate
8.39%
Create a Home Valuation Report for This Property
The Home Valuation Report is an in-depth analysis detailing your home's value as well as a comparison with similar homes in the area
Home Values in the Area
Average Home Value in this Area
Purchase History
| Date | Buyer | Sale Price | Title Company |
|---|---|---|---|
| Gouse Ronald P | -- | Accommodation | |
| Gouse Ronald P | -- | -- | |
| Gouse Ronald P | $205,000 | -- | |
| Fleet Tr & Investment Services Inc | $133,000 | -- | |
| Schoolwerth Anton C | $110,000 | -- |
Source: Public Records
Mortgage History
| Date | Status | Borrower | Loan Amount |
|---|---|---|---|
| Previous Owner | Schoolwerth Anton C | $66,000 |
Source: Public Records
Tax History Compared to Growth
Tax History
| Year | Tax Paid | Tax Assessment Tax Assessment Total Assessment is a certain percentage of the fair market value that is determined by local assessors to be the total taxable value of land and additions on the property. | Land | Improvement |
|---|---|---|---|---|
| 2025 | $4,884 | $516,184 | -- | -- |
| 2024 | $4,500 | $469,258 | -- | -- |
| 2023 | $4,500 | $426,598 | $0 | $0 |
| 2022 | $4,307 | $387,816 | $0 | $0 |
| 2021 | $3,618 | $352,560 | $0 | $352,560 |
| 2020 | $1,667 | $201,854 | $0 | $0 |
| 2019 | $1,639 | $197,316 | $0 | $0 |
| 2018 | $1,598 | $193,637 | $0 | $0 |
| 2017 | $1,567 | $189,654 | $0 | $0 |
| 2016 | $1,536 | $185,753 | $0 | $0 |
| 2015 | $1,567 | $184,462 | $0 | $0 |
| 2014 | $1,571 | $132,998 | $0 | $0 |
Source: Public Records
Map
Nearby Homes
- 575 13th Ave S
- 534 12th Ave S Unit 534
- 604 12th Ave S Unit 604
- 634 12th Ave S Unit 634
- 603 12th Ave S
- 455 13th Ave S
- 581 14th Ave S
- 676 12th Ave S Unit 676
- 466 12th Ave S Unit D466
- 473 12th Ave S Unit B8
- 611 12th Ave S Unit 611
- 530 Broad Ave S Unit 530
- 548 Broad Ave S Unit 548
- 429 14th Ave S
- 676 Broad Ave S Unit J676
- 636 14th Ave S
- 578 12th Ave S Unit 578
- 574 12th Ave S Unit 574
- 572 12th Ave S Unit 572
- 570 12th Ave S Unit 570
- 568 12th Ave S Unit 568
- 564 12th Ave S Unit 564
- 562 12th Ave S Unit 562
- 560 12th Ave S Unit 560
- 558 12th Ave S Unit 558
- 554 12th Ave S Unit 554
- 548 12th Ave S Unit 548
- 544 12th Ave S Unit 544
- 528 12th Ave S Unit 528
- 526 12th Ave S Unit 526
- 524 12th Ave S Unit 524
- 520 12th Ave S Unit 520
- 518 12th Ave S Unit 518
- 512 12th Ave S Unit 512
- 510 12th Ave S Unit 510
- 500 12th Ave S Unit 500