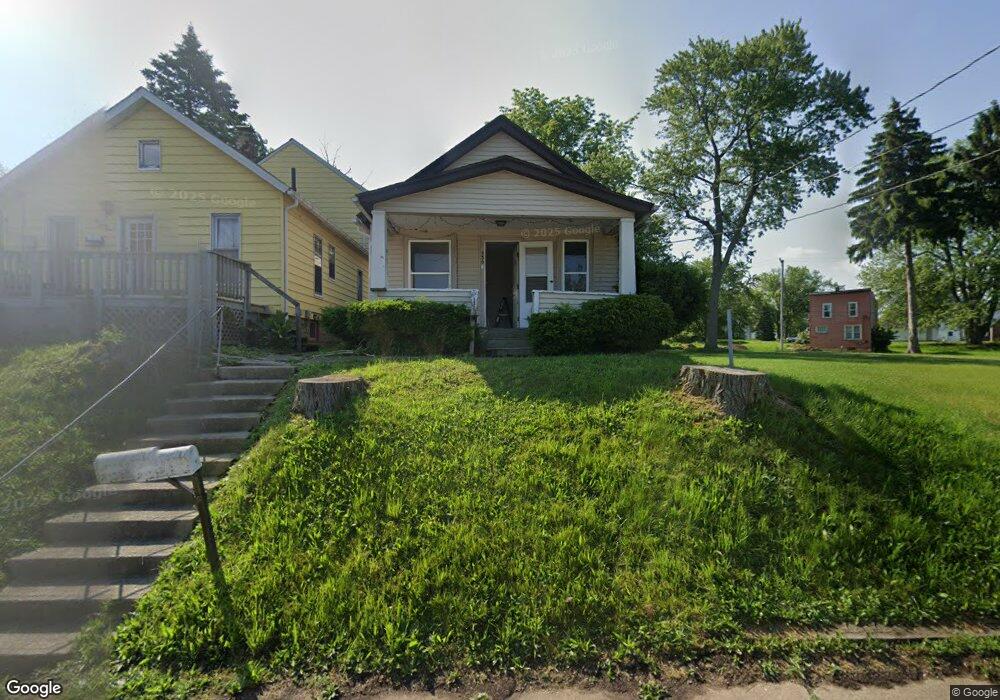
530 E 16th St Ashtabula, OH 44004
Estimated Value: $69,000 - $114,000
2
Beds
1
Bath
956
Sq Ft
$91/Sq Ft
Est. Value
About This Home
This home is located at 530 E 16th St, Ashtabula, OH 44004 and is currently estimated at $86,667, approximately $90 per square foot. 530 E 16th St is a home located in Ashtabula County with nearby schools including Lakeside High School and Christian Faith Academy.
Ownership History
Date
Name
Owned For
Owner Type
Purchase Details
Closed on
May 7, 2024
Sold by
Mcgrath David
Bought by
David Mcgrath Revocable Trust and Mcgrath
Current Estimated Value
Purchase Details
Closed on
Dec 26, 2014
Sold by
Mcgrath Management Llc
Bought by
Mcgrath David
Purchase Details
Closed on
Jun 7, 2012
Sold by
Grybosky Gary
Bought by
Mcgrath Managments Llc
Create a Home Valuation Report for This Property
The Home Valuation Report is an in-depth analysis detailing your home's value as well as a comparison with similar homes in the area
Home Values in the Area
Average Home Value in this Area
Purchase History
| Date | Buyer | Sale Price | Title Company |
|---|---|---|---|
| David Mcgrath Revocable Trust | -- | None Listed On Document | |
| David Mcgrath Revocable Trust | -- | None Listed On Document | |
| David Mcgrath Revocable Trust | -- | None Listed On Document | |
| Mcgrath David | $70,000 | Franklin Blair Title Agency | |
| Mcgrath Managments Llc | $39,900 | Chicago Title |
Source: Public Records
Tax History
| Year | Tax Paid | Tax Assessment Tax Assessment Total Assessment is a certain percentage of the fair market value that is determined by local assessors to be the total taxable value of land and additions on the property. | Land | Improvement |
|---|---|---|---|---|
| 2024 | $677 | $7,880 | $1,540 | $6,340 |
| 2023 | $435 | $7,880 | $1,540 | $6,340 |
| 2022 | $602 | $6,480 | $1,190 | $5,290 |
| 2021 | $533 | $6,480 | $1,190 | $5,290 |
| 2020 | $417 | $6,480 | $1,190 | $5,290 |
| 2019 | $476 | $7,140 | $1,330 | $5,810 |
| 2018 | $435 | $7,140 | $1,330 | $5,810 |
| 2017 | $434 | $7,140 | $1,330 | $5,810 |
| 2016 | $559 | $9,100 | $1,190 | $7,910 |
| 2015 | $544 | $9,100 | $1,190 | $7,910 |
| 2014 | $1,322 | $9,100 | $1,190 | $7,910 |
| 2013 | $749 | $14,110 | $1,090 | $13,020 |
Source: Public Records
Map
Nearby Homes
- 0 Scott Ave Unit 5167555
- 919 E 17th St
- 814 Richards Ave
- 0 E 23rd St Unit 5187222
- V/L W 12
- 1712 W 6th St
- 1728 W 10th St
- 1820 W 10th St
- 1010 Ohio Ave
- 1028 Ohio Ave
- 306 Pennsylvania Ave
- 1331 E 28th St
- 1031 Thayer Ave
- Carpenter W 19th Rd
- 1128 Myrtle Ave
- 1926 Walnut Blvd
- 3033 Avon Blvd
- 136 Minnesota Ave
- 3001 Blair Ave
- 3003 Blair Ave
Your Personal Tour Guide
Ask me questions while you tour the home.