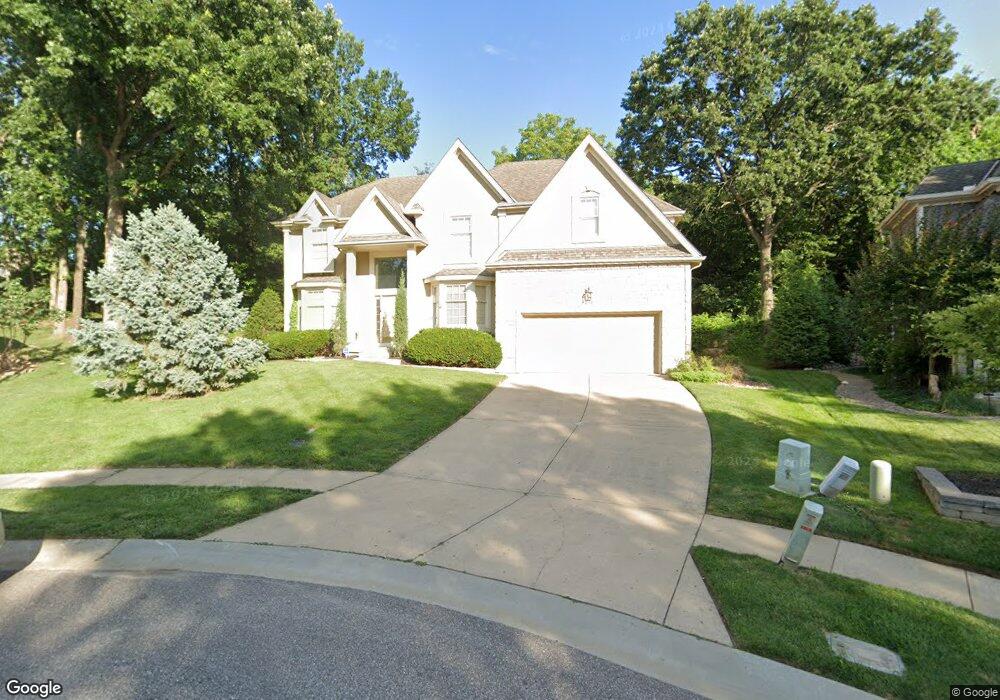
5305 Summit Ct Shawnee, KS 66216
Estimated Value: $556,195 - $597,000
4
Beds
4
Baths
3,115
Sq Ft
$184/Sq Ft
Est. Value
About This Home
This home is located at 5305 Summit Ct, Shawnee, KS 66216 and is currently estimated at $573,299, approximately $184 per square foot. 5305 Summit Ct is a home located in Johnson County with nearby schools including Ray Marsh Elementary School, Trailridge Middle School, and Shawnee Mission Northwest High School.
Ownership History
Date
Name
Owned For
Owner Type
Purchase Details
Closed on
Mar 12, 2020
Sold by
Houser Doug and Doug Houser Revocable Living T
Bought by
Houser Doug and Doug Houser Revocable Living T
Current Estimated Value
Purchase Details
Closed on
Oct 30, 2006
Sold by
Houser Doug
Bought by
Houser Doug
Purchase Details
Closed on
Jun 9, 2005
Sold by
Blandford Thomas E and Blandford Helen J
Bought by
Houser Doug
Home Financials for this Owner
Home Financials are based on the most recent Mortgage that was taken out on this home.
Original Mortgage
$262,000
Interest Rate
1.75%
Mortgage Type
Adjustable Rate Mortgage/ARM
Purchase Details
Closed on
Apr 9, 2005
Sold by
Blanford Thomas B and Blanford Helen
Bought by
Godke Bruce and Godke Heidi
Create a Home Valuation Report for This Property
The Home Valuation Report is an in-depth analysis detailing your home's value as well as a comparison with similar homes in the area
Home Values in the Area
Average Home Value in this Area
Purchase History
| Date | Buyer | Sale Price | Title Company |
|---|---|---|---|
| Houser Doug | -- | None Available | |
| Houser Doug | -- | None Available | |
| Houser Doug | -- | First American Title | |
| Godke Bruce | -- | None Available |
Source: Public Records
Mortgage History
| Date | Status | Borrower | Loan Amount |
|---|---|---|---|
| Previous Owner | Houser Doug | $262,000 |
Source: Public Records
Tax History Compared to Growth
Tax History
| Year | Tax Paid | Tax Assessment Tax Assessment Total Assessment is a certain percentage of the fair market value that is determined by local assessors to be the total taxable value of land and additions on the property. | Land | Improvement |
|---|---|---|---|---|
| 2024 | $5,752 | $54,027 | $13,493 | $40,534 |
| 2023 | $5,764 | $53,671 | $12,847 | $40,824 |
| 2022 | $5,425 | $50,347 | $12,847 | $37,500 |
| 2021 | $5,055 | $44,172 | $11,668 | $32,504 |
| 2020 | $4,940 | $42,504 | $10,192 | $32,312 |
| 2019 | $4,696 | $40,468 | $9,264 | $31,204 |
| 2018 | $4,713 | $40,468 | $9,264 | $31,204 |
| 2017 | $4,771 | $40,342 | $8,417 | $31,925 |
| 2016 | $4,762 | $39,756 | $8,417 | $31,339 |
| 2015 | $4,484 | $38,686 | $8,417 | $30,269 |
| 2013 | -- | $35,225 | $8,417 | $26,808 |
Source: Public Records
Map
Nearby Homes
- 5300 Summit Ct
- 13810 W 53rd St
- 5507 Noland Rd
- 5530 Rene St
- 5021 Bradshaw St
- 5013 Bradshaw St
- 13305 W 51st St
- 5703 Cottonwood St
- 5502 Mullen Rd
- 14210 W 50th St
- 5713 Widmer Rd
- 14170 W 49th St
- 14105 W 48th Terrace
- 5807 Noland Rd
- 12809 W 57th Terrace
- 5633 Oakview St
- 12508 W 56th St
- 5919 Pflumm Rd
- 13130 W 52nd Terrace
- 13126 W 52nd Terrace
- 5309 Summit Ct
- 5301 Summit Ct
- 13608 W 54th St
- 13604 W 54th St
- 5308 Summit Ct
- 5304 Summit Ct
- 5312 Summit Ct
- 13233 W 54th Terrace
- 13213 W 53rd Terrace
- 13217 W 53rd Terrace
- 13237 W 54th Terrace
- 5400 Summit Ct
- 13609 W 54th St
- 13229 W 54th Terrace
- 13601 W 54th St
- 13505 W 53rd Terrace
- 5404 Summit Ct
- 13519 W 53rd Terrace
- 13601 W 53rd Terrace
- 13515 W 53rd Terrace