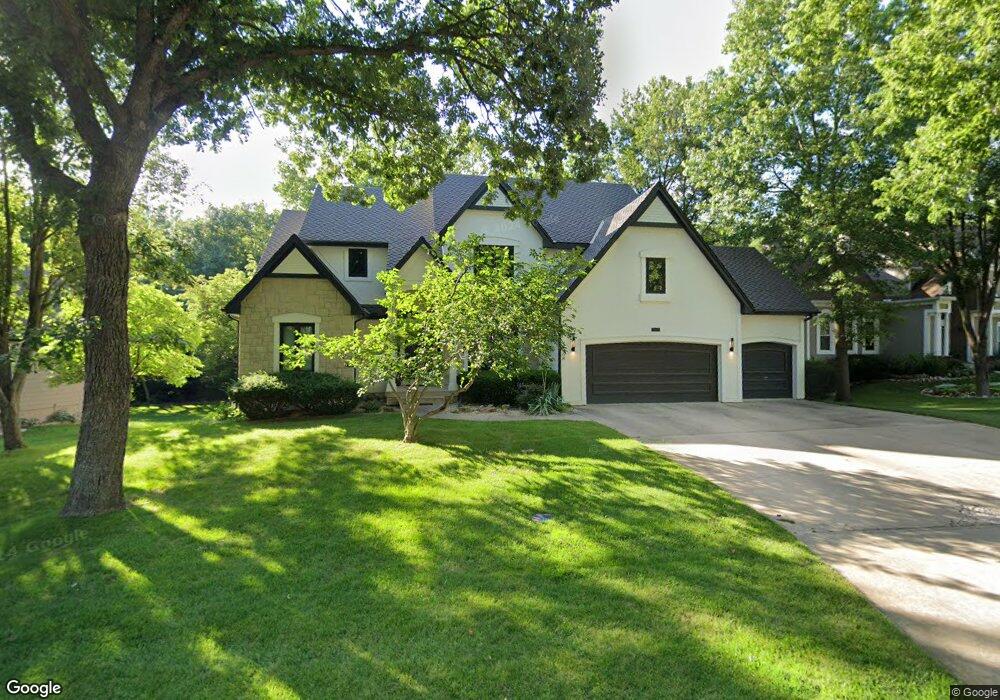
5308 Summit Ct Shawnee, KS 66216
Estimated Value: $532,000 - $593,000
4
Beds
4
Baths
3,046
Sq Ft
$184/Sq Ft
Est. Value
About This Home
This home is located at 5308 Summit Ct, Shawnee, KS 66216 and is currently estimated at $559,000, approximately $183 per square foot. 5308 Summit Ct is a home located in Johnson County with nearby schools including Ray Marsh Elementary School, Trailridge Middle School, and Shawnee Mission Northwest High School.
Ownership History
Date
Name
Owned For
Owner Type
Purchase Details
Closed on
Sep 5, 2019
Sold by
Waters Robert H and Waters Jamie B
Bought by
Waters Robert H and Waters Jamie B
Current Estimated Value
Purchase Details
Closed on
Jun 22, 2009
Sold by
Harris Max W and Harris Robin J
Bought by
Waters Robert H and Waters Jamie B
Home Financials for this Owner
Home Financials are based on the most recent Mortgage that was taken out on this home.
Original Mortgage
$219,000
Outstanding Balance
$137,469
Interest Rate
4.97%
Mortgage Type
Purchase Money Mortgage
Estimated Equity
$421,531
Purchase Details
Closed on
Jul 28, 2003
Sold by
Curtis C Duane and Curtis Patricia O
Bought by
Harris Max W and Harris Robin J
Home Financials for this Owner
Home Financials are based on the most recent Mortgage that was taken out on this home.
Original Mortgage
$267,920
Interest Rate
5.24%
Mortgage Type
Purchase Money Mortgage
Create a Home Valuation Report for This Property
The Home Valuation Report is an in-depth analysis detailing your home's value as well as a comparison with similar homes in the area
Home Values in the Area
Average Home Value in this Area
Purchase History
| Date | Buyer | Sale Price | Title Company |
|---|---|---|---|
| Waters Robert H | -- | None Available | |
| Waters Robert H | -- | First American Title Ins Co | |
| Harris Max W | -- | Old Republic Title Co Of Ks |
Source: Public Records
Mortgage History
| Date | Status | Borrower | Loan Amount |
|---|---|---|---|
| Open | Waters Robert H | $219,000 | |
| Previous Owner | Harris Max W | $267,920 |
Source: Public Records
Tax History
| Year | Tax Paid | Tax Assessment Tax Assessment Total Assessment is a certain percentage of the fair market value that is determined by local assessors to be the total taxable value of land and additions on the property. | Land | Improvement |
|---|---|---|---|---|
| 2025 | $5,608 | $54,407 | $13,162 | $41,245 |
| 2024 | $5,608 | $52,694 | $11,972 | $40,722 |
| 2023 | $5,566 | $51,830 | $11,409 | $40,421 |
| 2022 | $5,280 | $49,001 | $11,409 | $37,592 |
| 2021 | $5,051 | $44,137 | $10,375 | $33,762 |
| 2020 | $4,832 | $41,664 | $9,078 | $32,586 |
| 2019 | $4,650 | $40,066 | $8,255 | $31,811 |
| 2018 | $4,593 | $39,434 | $8,255 | $31,179 |
| 2017 | $4,748 | $40,146 | $7,508 | $32,638 |
| 2016 | $4,828 | $40,307 | $7,508 | $32,799 |
| 2015 | $4,549 | $39,249 | $7,508 | $31,741 |
| 2013 | -- | $34,845 | $7,508 | $27,337 |
Source: Public Records
Map
Nearby Homes
- 13505 W 53rd Terrace
- 13216 W 55th Terrace
- 13325 W 49th Terrace
- 14116 W 56th Ct
- 13611 W 49th Terrace
- 5021 Bradshaw St
- 5703 Cottonwood St
- 4911 Haskins St
- 14210 W 50th St
- 5828 Park Cir
- 12712 W 51st St
- 13821 W 58th Terrace Unit 1
- 13825 W 58th Terrace Unit 6
- 13721 W 58th Terrace Unit 1
- 13206 W 48th St
- 5751 Richards Cir
- 5537 Alden St
- 4852 Black Swan Dr
- 5450 Lackman Rd
- 13130 W 52nd Terrace
- 5312 Summit Ct
- 5304 Summit Ct
- 13608 W 54th St
- 5400 Summit Ct
- 5309 Summit Ct
- 5305 Summit Ct
- 13601 W 53rd Terrace
- 13605 W 53rd Terrace
- 13604 W 54th St
- 5301 Summit Ct
- 13519 W 53rd Terrace
- 5404 Summit Ct
- 13515 W 53rd Terrace
- 13609 W 54th St
- 13609 W 53rd Terrace
- 5408 Summit Ct
- 5313 Park St
- 13509 W 53rd Terrace
- 13604 W 53rd Terrace
- 5317 Park St
Your Personal Tour Guide
Ask me questions while you tour the home.