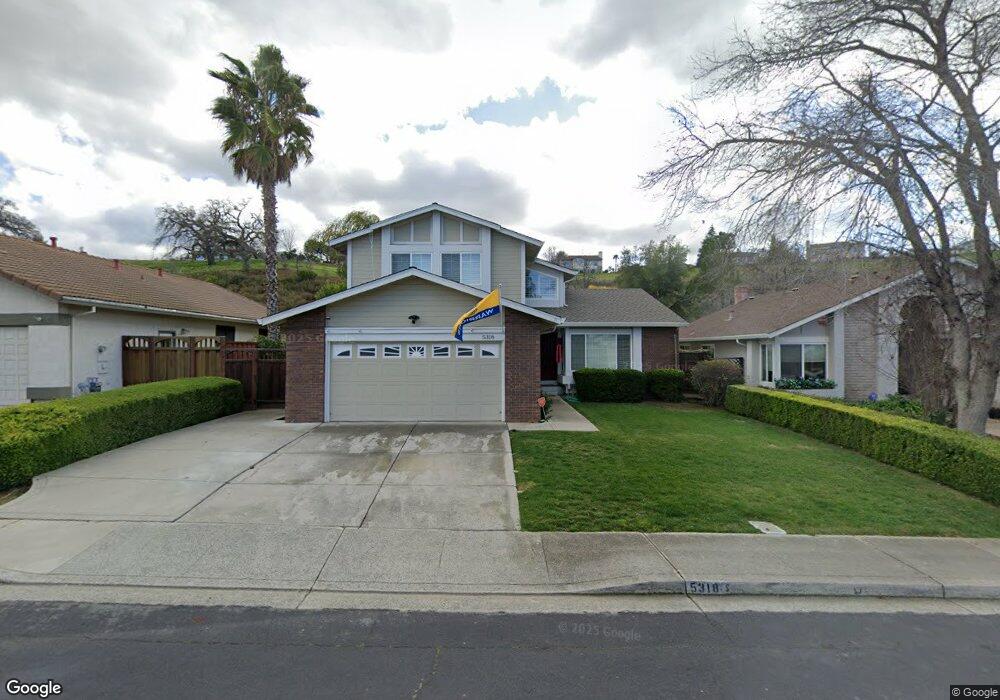
5318 Paso Del Rio Way Concord, CA 94521
The Highlands NeighborhoodEstimated Value: $1,052,367 - $1,188,000
4
Beds
3
Baths
2,187
Sq Ft
$509/Sq Ft
Est. Value
About This Home
This home is located at 5318 Paso Del Rio Way, Concord, CA 94521 and is currently estimated at $1,112,842, approximately $508 per square foot. 5318 Paso Del Rio Way is a home located in Contra Costa County with nearby schools including Highlands Elementary School, Mt. Diablo Elementary School, and Pine Hollow Middle School.
Ownership History
Date
Name
Owned For
Owner Type
Purchase Details
Closed on
Dec 1, 2020
Sold by
Megia Rexie Ian and Megia Jeannine Marie
Bought by
Megia Rexie and Megia Jeannine Marie
Current Estimated Value
Home Financials for this Owner
Home Financials are based on the most recent Mortgage that was taken out on this home.
Original Mortgage
$735,816
Outstanding Balance
$656,264
Interest Rate
2.8%
Mortgage Type
FHA
Estimated Equity
$456,578
Purchase Details
Closed on
Oct 25, 2019
Sold by
Kline Harvey M and Kline Jenete M
Bought by
Megla Rexie Ian and Manguiat Jeannine Marie
Home Financials for this Owner
Home Financials are based on the most recent Mortgage that was taken out on this home.
Original Mortgage
$739,213
Interest Rate
3.7%
Mortgage Type
FHA
Purchase Details
Closed on
Apr 7, 1994
Sold by
Meyer Gary P and Meyer Sally Jeanne
Bought by
Kline Harvey M and Kline Jenete M
Home Financials for this Owner
Home Financials are based on the most recent Mortgage that was taken out on this home.
Original Mortgage
$210,000
Interest Rate
7.59%
Mortgage Type
Purchase Money Mortgage
Create a Home Valuation Report for This Property
The Home Valuation Report is an in-depth analysis detailing your home's value as well as a comparison with similar homes in the area
Home Values in the Area
Average Home Value in this Area
Purchase History
| Date | Buyer | Sale Price | Title Company |
|---|---|---|---|
| Megia Rexie | -- | First American Title | |
| Megla Rexie Ian | $810,000 | Chicago Title Company | |
| Kline Harvey M | $262,500 | Chicago Title Company |
Source: Public Records
Mortgage History
| Date | Status | Borrower | Loan Amount |
|---|---|---|---|
| Open | Megia Rexie | $735,816 | |
| Previous Owner | Megla Rexie Ian | $739,213 | |
| Previous Owner | Kline Harvey M | $210,000 |
Source: Public Records
Tax History Compared to Growth
Tax History
| Year | Tax Paid | Tax Assessment Tax Assessment Total Assessment is a certain percentage of the fair market value that is determined by local assessors to be the total taxable value of land and additions on the property. | Land | Improvement |
|---|---|---|---|---|
| 2025 | $10,628 | $885,849 | $459,329 | $426,520 |
| 2024 | $10,628 | $868,480 | $450,323 | $418,157 |
| 2023 | $10,441 | $851,452 | $441,494 | $409,958 |
| 2022 | $10,316 | $834,758 | $432,838 | $401,920 |
| 2021 | $10,076 | $818,391 | $424,351 | $394,040 |
| 2020 | $10,014 | $810,000 | $420,000 | $390,000 |
| 2019 | $5,533 | $409,115 | $144,730 | $264,385 |
| 2018 | $5,325 | $401,094 | $141,893 | $259,201 |
| 2017 | $5,147 | $393,230 | $139,111 | $254,119 |
| 2016 | $5,001 | $385,521 | $136,384 | $249,137 |
| 2015 | $4,935 | $379,731 | $134,336 | $245,395 |
| 2014 | $4,928 | $372,294 | $131,705 | $240,589 |
Source: Public Records
Map
Nearby Homes
- 1169 Discovery Way
- 5497 Silver Sage Ct
- 1302 New Hampshire Dr
- 1152 Via Doble
- 1201 Illinois Ct
- 5146 Red Oak Dr
- 5470 Roundtree Dr Unit F
- 1140 Kenwal Rd
- 5508 Connecticut Dr
- 1181 Blue Lake Way
- 5540 Michigan Blvd
- 1395 Kenwal Rd Unit A
- 5555 Alabama Dr
- 5258 Pebble Glen Dr
- 5391 Fernbank Dr
- 5503 Pennsylvania Blvd
- 5333 Park Highlands Blvd Unit 34
- 5333 Park Highlands Blvd Unit 23
- 1056 Deer Oak Place
- 5295 Crystyl Ranch Dr
- 5316 Paso Del Rio Way
- 5320 Paso Del Rio Way
- 5314 Paso Del Rio Way
- 5322 Paso Del Rio Way
- 5315 Paso Del Rio Way
- 5313 Paso Del Rio Way
- 5317 Paso Del Rio Way
- 5311 Paso Del Rio Way
- 5324 Paso Del Rio Way
- 5312 Paso Del Rio Way
- 5319 Paso Del Rio Way
- 5309 Paso Del Rio Way
- 5326 Paso Del Rio Way
- 5310 Paso Del Rio Way
- 5321 Paso Del Rio Way
- 5351 Grasswood Cir
- 5307 Paso Del Rio Way
- 5353 Grasswood Cir
- 5328 Paso Del Rio Way
- 5308 Paso Del Rio Way