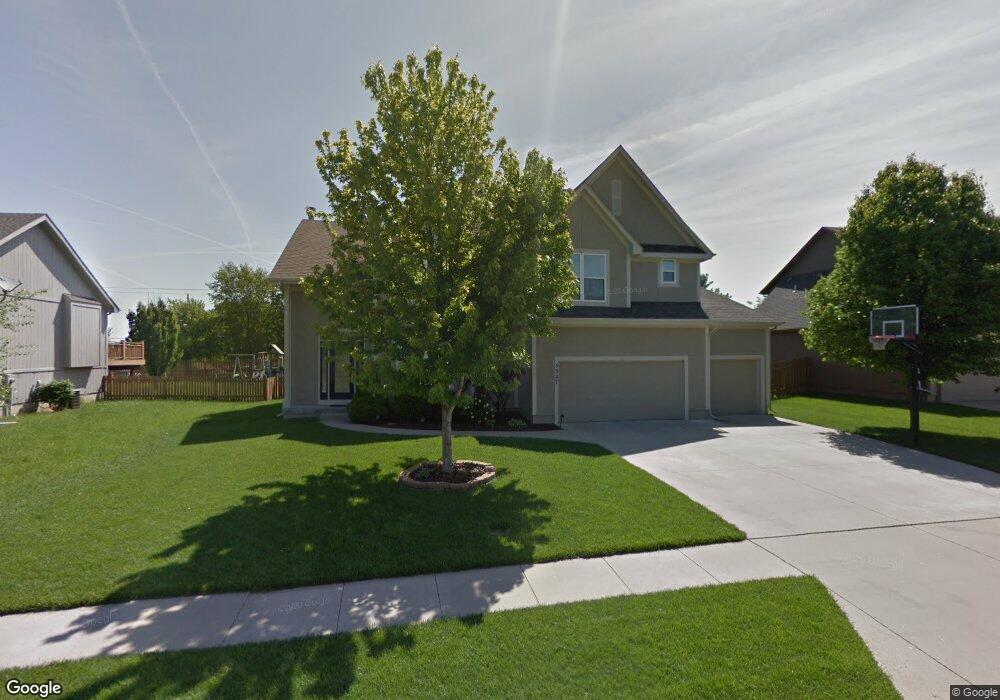
5327 Kenton Rd Shawnee, KS 66226
Estimated Value: $491,000 - $518,000
4
Beds
5
Baths
2,320
Sq Ft
$216/Sq Ft
Est. Value
About This Home
This home is located at 5327 Kenton Rd, Shawnee, KS 66226 and is currently estimated at $501,000, approximately $215 per square foot. 5327 Kenton Rd is a home located in Johnson County with nearby schools including Belmont Elementary School, Mill Creek Middle School, and Mill Valley High School.
Ownership History
Date
Name
Owned For
Owner Type
Purchase Details
Closed on
Jun 18, 2021
Sold by
Colwell Michael G and Colwell Karen C
Bought by
Jordan Gabriel and Jordan Haley
Current Estimated Value
Purchase Details
Closed on
Sep 12, 2002
Sold by
Fromholtz Michael E
Bought by
Brimblecom William H and Brimblecom Julie M
Home Financials for this Owner
Home Financials are based on the most recent Mortgage that was taken out on this home.
Original Mortgage
$200,400
Interest Rate
6.21%
Purchase Details
Closed on
Feb 12, 2002
Sold by
Highland Ridge Development Co Llc
Bought by
Fromholtz Michael E
Home Financials for this Owner
Home Financials are based on the most recent Mortgage that was taken out on this home.
Original Mortgage
$188,480
Interest Rate
7.12%
Mortgage Type
Construction
Create a Home Valuation Report for This Property
The Home Valuation Report is an in-depth analysis detailing your home's value as well as a comparison with similar homes in the area
Home Values in the Area
Average Home Value in this Area
Purchase History
| Date | Buyer | Sale Price | Title Company |
|---|---|---|---|
| Jordan Gabriel | -- | Meridian Title Company | |
| Brimblecom William H | -- | Stewart Title Inc | |
| Fromholtz Michael E | -- | Stewart Title |
Source: Public Records
Mortgage History
| Date | Status | Borrower | Loan Amount |
|---|---|---|---|
| Previous Owner | Brimblecom William H | $200,400 | |
| Previous Owner | Fromholtz Michael E | $188,480 |
Source: Public Records
Tax History Compared to Growth
Tax History
| Year | Tax Paid | Tax Assessment Tax Assessment Total Assessment is a certain percentage of the fair market value that is determined by local assessors to be the total taxable value of land and additions on the property. | Land | Improvement |
|---|---|---|---|---|
| 2024 | $6,067 | $52,107 | $8,096 | $44,011 |
| 2023 | $5,853 | $49,761 | $8,096 | $41,665 |
| 2022 | $5,245 | $43,700 | $7,032 | $36,668 |
| 2021 | $4,763 | $38,145 | $6,696 | $31,449 |
| 2020 | $4,427 | $35,121 | $6,696 | $28,425 |
| 2019 | $4,340 | $33,925 | $5,572 | $28,353 |
| 2018 | $4,218 | $32,683 | $5,572 | $27,111 |
| 2017 | $4,128 | $31,200 | $5,280 | $25,920 |
| 2016 | $3,987 | $29,762 | $5,280 | $24,482 |
| 2015 | $3,831 | $28,118 | $5,280 | $22,838 |
| 2013 | -- | $26,714 | $5,284 | $21,430 |
Source: Public Records
Map
Nearby Homes
- 5221 Meadow View Dr
- 5625 Meadow View Dr
- 5137 Meadowlark Dr
- 22910 W 51st St
- 5858 Mccormick Dr
- 5408 Aminda St
- 5764 Apache Dr
- 22605 W 56th St
- 22714 W 49th St
- 22625 W 49th St
- The Paxton III Plan at Canyon Lakes
- The Sydney III Plan at Canyon Lakes
- The Harlow V Plan at Canyon Lakes
- The Hailey Plan at Canyon Lakes
- The Brooklyn II Plan at Canyon Lakes
- The Niko Plan at Canyon Lakes
- The Payton Plan at Canyon Lakes
- The Aspen Plan at Canyon Lakes
- The Levi II Plan at Canyon Lakes
- The Madison Plan at Canyon Lakes
- 5327 Kenton St
- 5331 Kenton Rd
- 5323 Kenton Rd
- 5328 Kenton St
- 5328 Kenton Rd
- 5332 Kenton St
- 5332 Kenton Rd
- 5324 Kenton St
- 5324 Kenton Rd
- 23475 W 53rd Terrace
- 5339 Kenton Rd
- 5336 Kenton Rd
- 5375 Old K 7 Hwy
- 23508 W 53rd Terrace
- 23512 W 53rd Terrace
- 23445 W 53rd Terrace
- 5340 Kenton Rd
- 5329 Meadowlark Dr
- 23516 W 53rd Terrace
- 5343 Kenton Rd