D
Landlord's Agent in 2025
Darren Dunn
PPG Property Management, LLC
(623) 688-7850
1 in this area
8 Total Sales
Estimated Value: $361,000 - $391,000
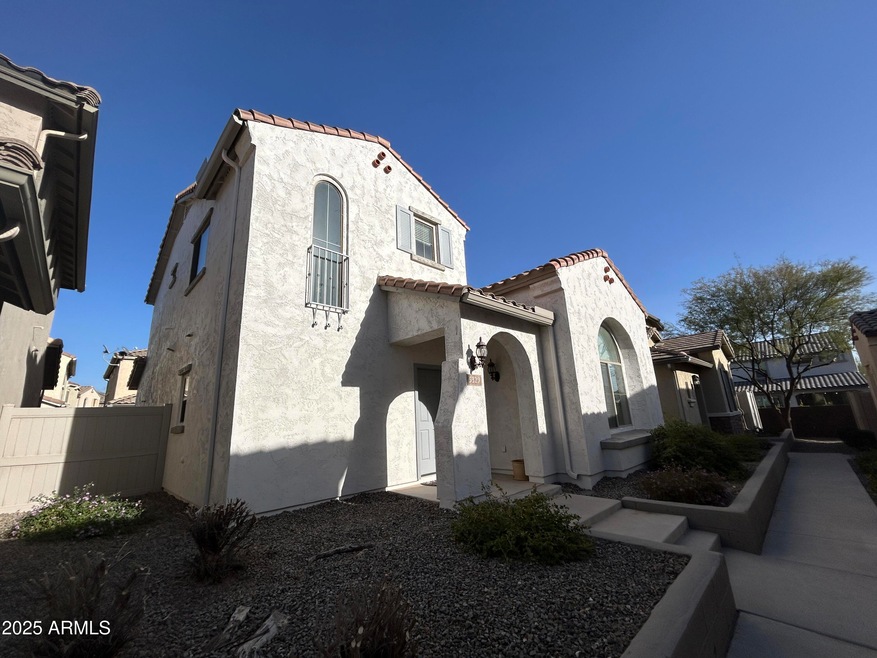
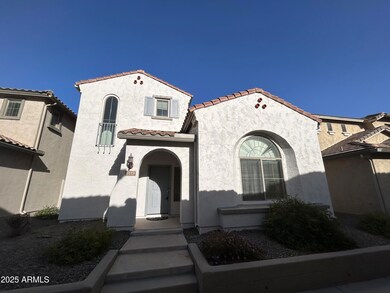
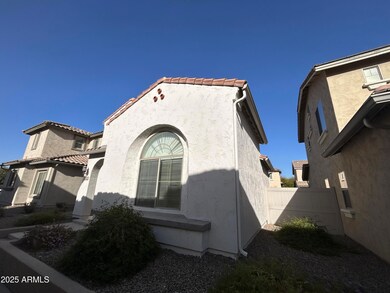
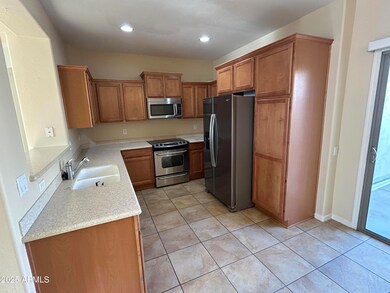
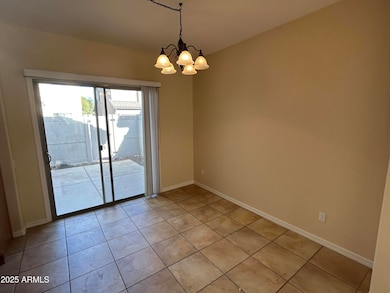
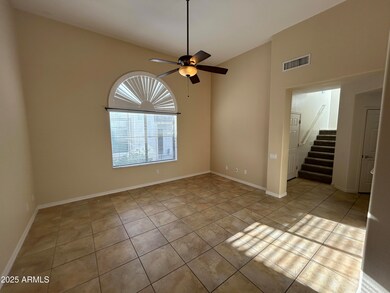
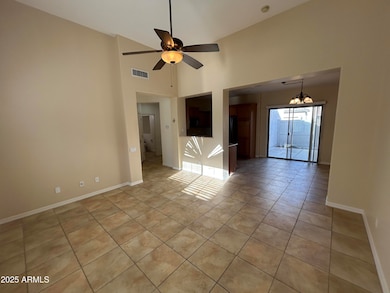
Introducing a charming 2-bedroom, 2.5-bathroom house located in north Phoenix in the highly sought after community of Stetson Valley ready for immediate move-in. This home features new interior paint, ceramic tile floors throughout the downstairs, and new carpet for added comfort. The kitchen boasts stainless steel appliances, granite slab countertops, and maple cabinets, perfect for any cooking enthusiast. With an attached 2-car garage, parking is a breeze. Don't miss out on the opportunity to make this house your home. Play in the community park (Deems Hills), hike/mountain bike the neighboring mountains or take a dip in the community pool
Last Agent to Rent the Property
PPG Property Management, LLC License #SA681867000 Listed on: 03/27/2025
Last Renter's Agent
PPG Property Management, LLC License #SA681867000 Listed on: 03/27/2025
| Date | Buyer | Sale Price | Title Company |
|---|---|---|---|
| Miller Brent A | $167,500 | Title Source | |
| Charles Schwab Bank | $162,450 | Great American Title Agency | |
| Young Sandra D | $230,211 | Sun Title Agency Co |
| Date | Status | Borrower | Loan Amount |
|---|---|---|---|
| Open | Miller Brent A | $159,125 | |
| Previous Owner | Young Sandra D | $184,168 |
| Date | Event | Price | List to Sale | Price per Sq Ft | Prior Sale |
|---|---|---|---|---|---|
| 04/26/2025 04/26/25 | Rented | $1,900 | 0.0% | -- | |
| 04/11/2025 04/11/25 | Under Contract | -- | -- | -- | |
| 03/27/2025 03/27/25 | For Rent | $1,900 | 0.0% | -- | |
| 05/31/2014 05/31/14 | Sold | $167,500 | -4.3% | $128 / Sq Ft | View Prior Sale |
| 04/22/2014 04/22/14 | Pending | -- | -- | -- | |
| 04/06/2014 04/06/14 | For Sale | $175,000 | -- | $134 / Sq Ft |
| Year | Tax Paid | Tax Assessment Tax Assessment Total Assessment is a certain percentage of the fair market value that is determined by local assessors to be the total taxable value of land and additions on the property. | Land | Improvement |
|---|---|---|---|---|
| 2025 | $1,777 | $17,326 | -- | -- |
| 2024 | $1,466 | $16,501 | -- | -- |
| 2023 | $1,466 | $26,700 | $5,340 | $21,360 |
| 2022 | $1,412 | $19,980 | $3,990 | $15,990 |
| 2021 | $1,474 | $18,400 | $3,680 | $14,720 |
| 2020 | $1,447 | $16,870 | $3,370 | $13,500 |
| 2019 | $1,403 | $15,830 | $3,160 | $12,670 |
| 2018 | $1,354 | $14,650 | $2,930 | $11,720 |
| 2017 | $1,308 | $13,400 | $2,680 | $10,720 |
| 2016 | $1,234 | $12,670 | $2,530 | $10,140 |
| 2015 | $1,101 | $11,260 | $2,250 | $9,010 |
D
Landlord's Agent in 2025
Darren Dunn
PPG Property Management, LLC
(623) 688-7850
1 in this area
8 Total Sales

Seller's Agent in 2014
Kathleen McMullen
Dream Home Catchers, LLC
(623) 512-8152
117 Total Sales
J
Buyer's Agent in 2014
Jason Poyner
Phoenix Property Group
Source: Arizona Regional Multiple Listing Service (ARMLS)
MLS Number: 6841767
APN: 201-40-752
Disclaimer: Certain information contained herein is derived from information provided by parties other than Homes.com. All information provided is deemed reliable, but is not guaranteed to be accurate and should be independently verified.
![]() All information should be verified by the recipient and none is guaranteed as accurate by ARMLS
All information should be verified by the recipient and none is guaranteed as accurate by ARMLS
Listing Information presented by local MLS brokerage: Ten-X, local REALTOR®- Arlene Richardson - (888)-952-6393
Ask me questions while you tour the home.