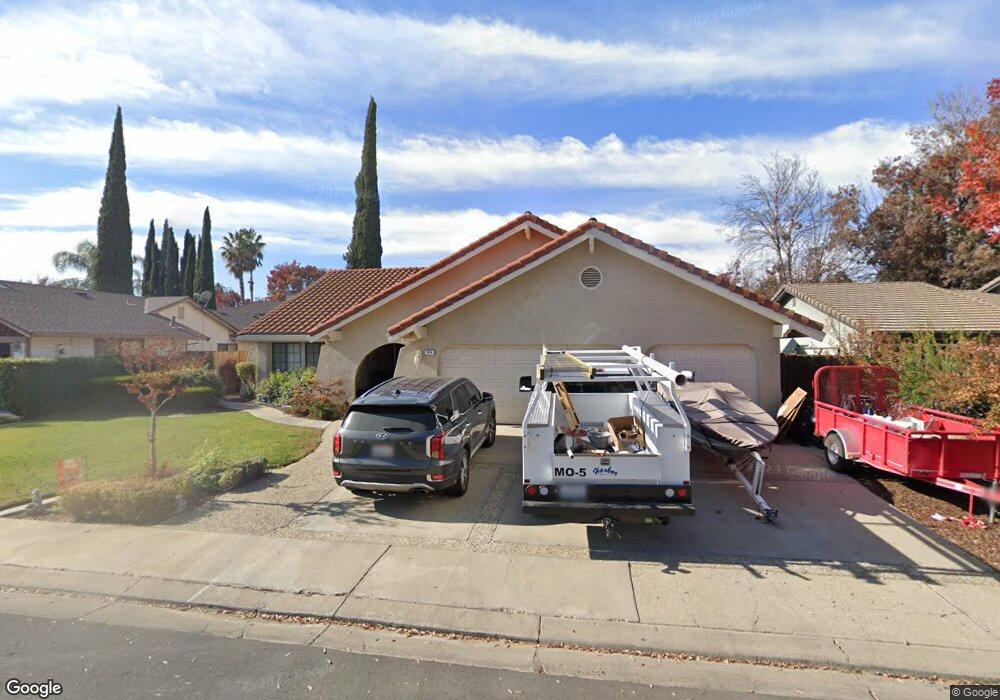
533 Amberina Ct Patterson, CA 95363
Estimated Value: $466,000 - $505,000
3
Beds
2
Baths
1,800
Sq Ft
$266/Sq Ft
Est. Value
About This Home
This home is located at 533 Amberina Ct, Patterson, CA 95363 and is currently estimated at $479,306, approximately $266 per square foot. 533 Amberina Ct is a home located in Stanislaus County with nearby schools including Las Palmas Elementary School, Creekside Middle School, and Patterson High School.
Ownership History
Date
Name
Owned For
Owner Type
Purchase Details
Closed on
Apr 20, 2016
Sold by
Woman Rebecca L and Frunz Rebecca L
Bought by
Brewer Rebecca L and Brewer Corey A
Current Estimated Value
Home Financials for this Owner
Home Financials are based on the most recent Mortgage that was taken out on this home.
Original Mortgage
$181,016
Outstanding Balance
$142,968
Interest Rate
3.75%
Mortgage Type
FHA
Estimated Equity
$336,338
Purchase Details
Closed on
May 30, 2002
Sold by
Wilson Pearl V
Bought by
Frunz Brian J and Frunz Rebecca L
Home Financials for this Owner
Home Financials are based on the most recent Mortgage that was taken out on this home.
Original Mortgage
$190,400
Interest Rate
6.74%
Purchase Details
Closed on
Jun 15, 1998
Sold by
Trindel Ralph and Trindel Ellinore
Bought by
Wilson Pearl V
Create a Home Valuation Report for This Property
The Home Valuation Report is an in-depth analysis detailing your home's value as well as a comparison with similar homes in the area
Home Values in the Area
Average Home Value in this Area
Purchase History
| Date | Buyer | Sale Price | Title Company |
|---|---|---|---|
| Brewer Rebecca L | -- | Chicago Title Company | |
| Brewer Rebecca L | -- | Chicago Title Company | |
| Frunz Brian J | $238,000 | Stewart Title | |
| Wilson Pearl V | $160,000 | Stewart Title |
Source: Public Records
Mortgage History
| Date | Status | Borrower | Loan Amount |
|---|---|---|---|
| Open | Brewer Rebecca L | $181,016 | |
| Closed | Frunz Brian J | $190,400 |
Source: Public Records
Tax History
| Year | Tax Paid | Tax Assessment Tax Assessment Total Assessment is a certain percentage of the fair market value that is determined by local assessors to be the total taxable value of land and additions on the property. | Land | Improvement |
|---|---|---|---|---|
| 2025 | $3,989 | $351,576 | $134,423 | $217,153 |
| 2024 | $3,976 | $344,684 | $131,788 | $212,896 |
| 2023 | $3,884 | $337,926 | $129,204 | $208,722 |
| 2022 | $3,659 | $331,301 | $126,671 | $204,630 |
| 2021 | $3,628 | $324,806 | $124,188 | $200,618 |
| 2020 | $3,607 | $321,476 | $122,915 | $198,561 |
| 2019 | $3,549 | $315,173 | $120,505 | $194,668 |
| 2018 | $3,374 | $308,994 | $118,143 | $190,851 |
| 2017 | $2,949 | $271,000 | $100,000 | $171,000 |
| 2016 | $2,903 | $269,000 | $70,000 | $199,000 |
| 2015 | $2,642 | $245,000 | $35,000 | $210,000 |
| 2014 | $2,260 | $211,000 | $30,000 | $181,000 |
Source: Public Records
Map
Nearby Homes
- 708 Bonneau Ct
- 15707 S 9th St
- 855 Toyon Ln
- 850 Miraggio Dr
- 1008 Summer Ln
- 191 Fall Ave
- 1117 Van Gogh Ln
- 1127 Kestrel Dr
- 357 Wolfpack Ct
- 1132 Marsh Wren Ct
- 409 Osprey Dr
- 1242 Yellowhammer Dr
- 433 Sanderling Dr
- 403 Elfers Rd
- 425 Elfers Rd
- 647 Ward Ave
- 642 Wanzia Ct
- 192 Torvend Way
- 1314 Sutter Creek Ct
- 701 N 3rd St
Your Personal Tour Guide
Ask me questions while you tour the home.