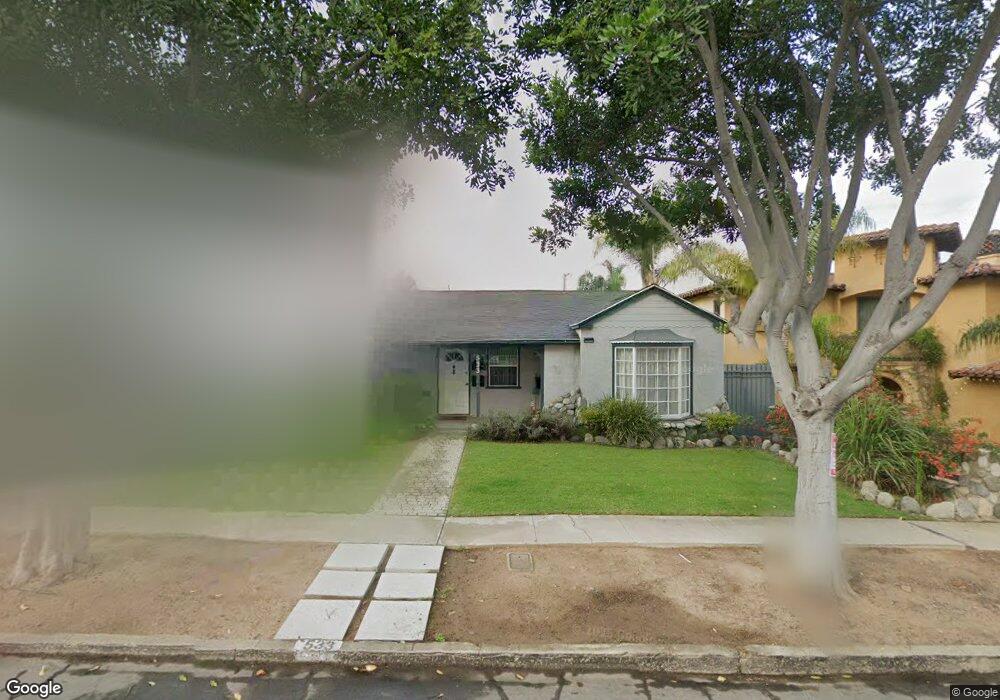
533 Concord St El Segundo, CA 90245
Estimated Value: $1,573,000 - $1,890,000
2
Beds
2
Baths
1,574
Sq Ft
$1,097/Sq Ft
Est. Value
About This Home
This home is located at 533 Concord St, El Segundo, CA 90245 and is currently estimated at $1,726,227, approximately $1,096 per square foot. 533 Concord St is a home located in Los Angeles County with nearby schools including Richmond Street Elementary School, El Segundo Middle School, and El Segundo High School.
Ownership History
Date
Name
Owned For
Owner Type
Purchase Details
Closed on
Nov 7, 2018
Sold by
Yocum
Bought by
South
Current Estimated Value
Home Financials for this Owner
Home Financials are based on the most recent Mortgage that was taken out on this home.
Interest Rate
4.83%
Purchase Details
Closed on
Apr 2, 2001
Sold by
Barnust Properties Ltd
Bought by
Insatiable Assets Llc
Purchase Details
Closed on
Oct 24, 2000
Sold by
Southard Marvin J and Estate Of Signa Mondon
Bought by
Barnust Properties Ltd
Create a Home Valuation Report for This Property
The Home Valuation Report is an in-depth analysis detailing your home's value as well as a comparison with similar homes in the area
Home Values in the Area
Average Home Value in this Area
Purchase History
| Date | Buyer | Sale Price | Title Company |
|---|---|---|---|
| South | -- | -- | |
| Insatiable Assets Llc | -- | North American Title | |
| Barnust Properties Ltd | $181,000 | Fidelity Title |
Source: Public Records
Mortgage History
| Date | Status | Borrower | Loan Amount |
|---|---|---|---|
| Previous Owner | South | -- |
Source: Public Records
Tax History
| Year | Tax Paid | Tax Assessment Tax Assessment Total Assessment is a certain percentage of the fair market value that is determined by local assessors to be the total taxable value of land and additions on the property. | Land | Improvement |
|---|---|---|---|---|
| 2025 | $5,510 | $483,693 | $348,509 | $135,184 |
| 2024 | $5,510 | $474,210 | $341,676 | $132,534 |
| 2023 | $5,371 | $464,913 | $334,977 | $129,936 |
| 2022 | $5,429 | $455,798 | $328,409 | $127,389 |
| 2021 | $5,352 | $446,862 | $321,970 | $124,892 |
| 2019 | $5,173 | $433,610 | $312,421 | $121,189 |
| 2018 | $4,802 | $425,109 | $306,296 | $118,813 |
| 2016 | $4,656 | $408,603 | $294,403 | $114,200 |
| 2015 | $4,598 | $402,466 | $289,981 | $112,485 |
| 2014 | $4,508 | $394,583 | $284,301 | $110,282 |
Source: Public Records
Map
Nearby Homes
- 412 Richmond St
- 408 Loma Vista St
- 328 Virginia St Unit 4
- 627 W Pine Ave
- 745 Main St
- 724 Loma Vista St
- 211 E Pine Ave
- 355 Hillcrest St
- 804 Hillcrest St
- 329 E Maple Ave
- 121 E Walnut Ave
- 228 Arena St Unit B
- 228 Arena St Unit A
- 219 W Acacia Ave
- 924 Main St
- 935 Main St Unit 303
- 226 Arena St Unit B
- 226 Arena St
- 955 Virginia St
- 221 Sheldon St
- 539 Concord St
- 527 Concord St
- 302 W Mariposa Ave
- 521 Concord St
- 517 Concord St
- 532 Virginia St
- 536 Virginia St
- 526 Virginia St
- 544 Virginia St Unit 544.5
- 544 Virginia St
- 522 Virginia St
- 530 Concord St
- 534 Concord St
- 524 Concord St
- 511 Concord St
- 520 Concord St
- 516 Virginia St
- 516 Concord St
- 507 Concord St
- 510 Virginia St
Your Personal Tour Guide
Ask me questions while you tour the home.