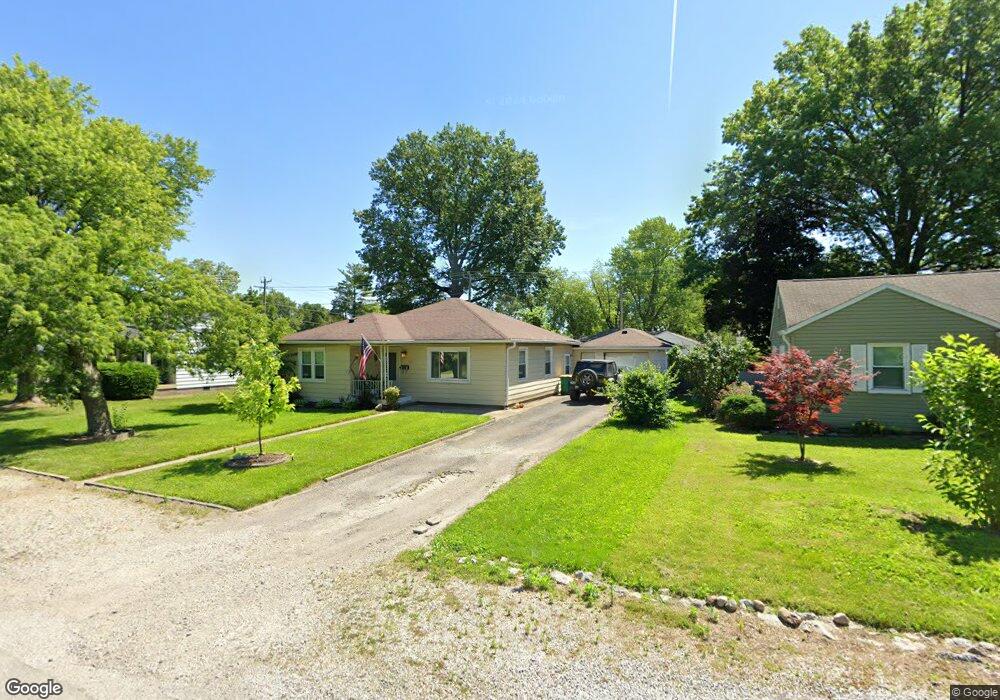
533 Duffey St Plainfield, IN 46168
Estimated Value: $217,851 - $233,000
2
Beds
1
Bath
1,364
Sq Ft
$165/Sq Ft
Est. Value
About This Home
This home is located at 533 Duffey St, Plainfield, IN 46168 and is currently estimated at $225,213, approximately $165 per square foot. 533 Duffey St is a home located in Hendricks County with nearby schools including Van Buren Elementary School, Plainfield Community Middle School, and Plainfield High School.
Ownership History
Date
Name
Owned For
Owner Type
Purchase Details
Closed on
May 4, 2018
Sold by
Miles Samuel A
Bought by
Lynch Deanna
Current Estimated Value
Home Financials for this Owner
Home Financials are based on the most recent Mortgage that was taken out on this home.
Original Mortgage
$91,575
Outstanding Balance
$78,849
Interest Rate
4.4%
Mortgage Type
FHA
Estimated Equity
$146,364
Purchase Details
Closed on
Mar 5, 2007
Sold by
Dlj Mortgage Capital Inc
Bought by
Miles Samule A
Home Financials for this Owner
Home Financials are based on the most recent Mortgage that was taken out on this home.
Original Mortgage
$74,100
Interest Rate
6.37%
Mortgage Type
Adjustable Rate Mortgage/ARM
Purchase Details
Closed on
Jan 18, 2007
Sold by
Whittaker John Andrew and Whittaker John A
Bought by
Dlj Mortgage Capital Inc
Home Financials for this Owner
Home Financials are based on the most recent Mortgage that was taken out on this home.
Original Mortgage
$74,100
Interest Rate
6.37%
Mortgage Type
Adjustable Rate Mortgage/ARM
Create a Home Valuation Report for This Property
The Home Valuation Report is an in-depth analysis detailing your home's value as well as a comparison with similar homes in the area
Home Values in the Area
Average Home Value in this Area
Purchase History
| Date | Buyer | Sale Price | Title Company |
|---|---|---|---|
| Lynch Deanna | $105,000 | First American Title | |
| Miles Samule A | -- | None Available | |
| Dlj Mortgage Capital Inc | $100,889 | None Available |
Source: Public Records
Mortgage History
| Date | Status | Borrower | Loan Amount |
|---|---|---|---|
| Open | Lynch Deanna | $91,575 | |
| Previous Owner | Miles Samule A | $74,100 |
Source: Public Records
Tax History Compared to Growth
Tax History
| Year | Tax Paid | Tax Assessment Tax Assessment Total Assessment is a certain percentage of the fair market value that is determined by local assessors to be the total taxable value of land and additions on the property. | Land | Improvement |
|---|---|---|---|---|
| 2024 | $1,210 | $155,100 | $24,600 | $130,500 |
| 2023 | $1,110 | $147,700 | $23,400 | $124,300 |
| 2022 | $1,122 | $140,800 | $22,300 | $118,500 |
| 2021 | $943 | $124,500 | $22,300 | $102,200 |
| 2020 | $1,111 | $133,000 | $22,300 | $110,700 |
| 2019 | $999 | $125,200 | $20,900 | $104,300 |
| 2018 | $939 | $122,800 | $20,900 | $101,900 |
| 2017 | $707 | $102,200 | $20,100 | $82,100 |
| 2016 | $658 | $98,700 | $20,100 | $78,600 |
| 2014 | $583 | $91,800 | $19,000 | $72,800 |
Source: Public Records
Map
Nearby Homes
- 309 Duffey St
- 980 Andico Rd
- 210 Kentucky Ave
- 100 Lincoln St
- 325 N Center St
- 311 N Center St
- 628 Gibbs Ct
- 225 N Center St
- 60 Pike Place
- 2394 Eagle Ave
- 2198 Galleone Way
- 147 N Center St
- 645 Masten St
- 416 Linden Ln
- 7574 Williamsburg Dr
- 2856 Colony Lake Dr E
- 59 Elm Dr
- 504 Magnolia Dr
- 327 S Mill St
- 1407 Miami Ct N