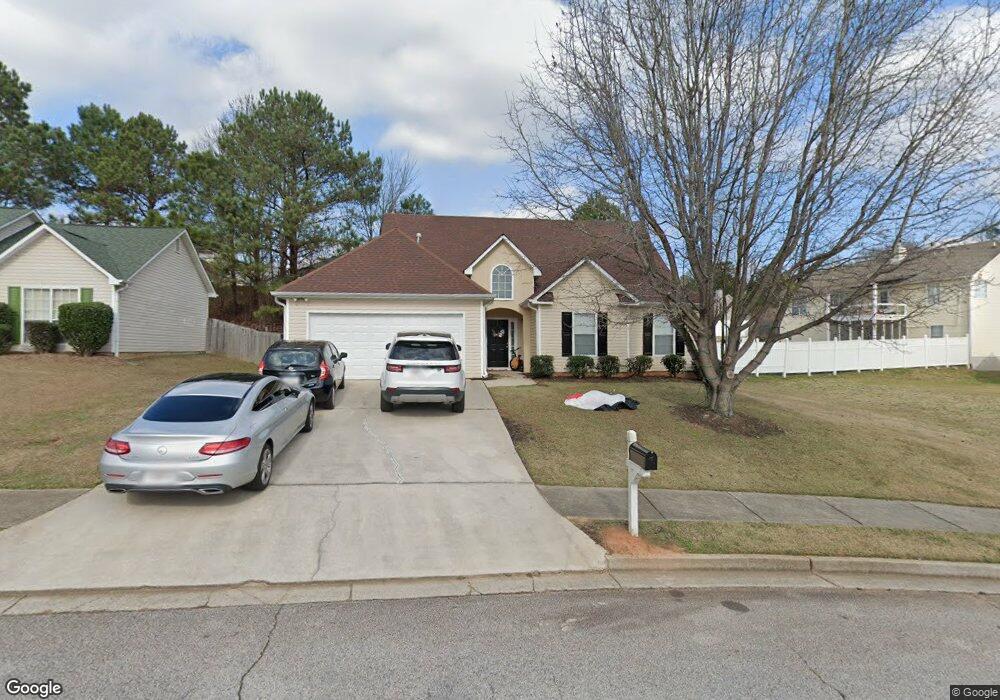
533 Halley Way Unit 92 Stockbridge, GA 30281
Estimated Value: $276,000 - $300,000
4
Beds
2
Baths
1,990
Sq Ft
$145/Sq Ft
Est. Value
About This Home
This home is located at 533 Halley Way Unit 92, Stockbridge, GA 30281 and is currently estimated at $289,402, approximately $145 per square foot. 533 Halley Way Unit 92 is a home located in Henry County with nearby schools including Stockbridge Elementary School, Smith-Barnes Elementary School, and Eagle's Landing Middle School.
Ownership History
Date
Name
Owned For
Owner Type
Purchase Details
Closed on
Feb 19, 2025
Sold by
Progress Residential Trs16 Llc
Bought by
Ouy Eric and Ouy Veronica
Current Estimated Value
Purchase Details
Closed on
Dec 12, 2024
Sold by
Progress Residential Borrower 16 Llc
Bought by
Progress Residential Trs16 Llc
Purchase Details
Closed on
Jan 4, 2021
Sold by
Ofori Frank B
Bought by
Progress Atlanta Llc
Purchase Details
Closed on
Jul 30, 2020
Sold by
Ofori Frank
Bought by
Ofori Frank and Ofori Nana
Purchase Details
Closed on
Sep 14, 2000
Sold by
Tim Jones Communities Inc
Bought by
Ofori Frank
Home Financials for this Owner
Home Financials are based on the most recent Mortgage that was taken out on this home.
Original Mortgage
$113,300
Interest Rate
7.77%
Mortgage Type
New Conventional
Create a Home Valuation Report for This Property
The Home Valuation Report is an in-depth analysis detailing your home's value as well as a comparison with similar homes in the area
Home Values in the Area
Average Home Value in this Area
Purchase History
| Date | Buyer | Sale Price | Title Company |
|---|---|---|---|
| Ouy Eric | $285,000 | -- | |
| Progress Residential Trs16 Llc | -- | -- | |
| Progress Atlanta Llc | $196,400 | -- | |
| Ofori Frank | -- | -- | |
| Ofori Frank | $119,300 | -- |
Source: Public Records
Mortgage History
| Date | Status | Borrower | Loan Amount |
|---|---|---|---|
| Previous Owner | Ofori Frank | $113,300 |
Source: Public Records
Tax History Compared to Growth
Tax History
| Year | Tax Paid | Tax Assessment Tax Assessment Total Assessment is a certain percentage of the fair market value that is determined by local assessors to be the total taxable value of land and additions on the property. | Land | Improvement |
|---|---|---|---|---|
| 2025 | $5,050 | $122,480 | $12,000 | $110,480 |
| 2024 | $5,050 | $114,880 | $12,000 | $102,880 |
| 2023 | $4,761 | $112,360 | $10,000 | $102,360 |
| 2022 | $3,234 | $78,560 | $8,799 | $69,761 |
| 2021 | $2,760 | $66,120 | $10,000 | $56,120 |
| 2020 | $2,637 | $62,880 | $8,000 | $54,880 |
| 2019 | $2,432 | $59,160 | $8,000 | $51,160 |
| 2018 | $2,246 | $54,280 | $8,000 | $46,280 |
| 2016 | $2,057 | $49,360 | $8,000 | $41,360 |
| 2015 | $1,845 | $42,520 | $6,000 | $36,520 |
| 2014 | $1,547 | $34,560 | $4,800 | $29,760 |
Source: Public Records
Map
Nearby Homes
- 816 Lorraine Ln Unit 4
- 9 Cheyenne Dr
- 172 Garden Walk
- 100 Garden Walk
- 537 Goldfinch Way
- 144 Garden Walk
- 113 Garden Walk
- 503 Goldfinch Way
- 564 Goldfinch Way
- 0 Rock Quarry Rd Unit 10142677
- 128 Garden Walk
- 396 Avian Forest Dr
- 137 Dustin Dr
- 105 Windsong Dr
- 377 Avian Forest Dr
- 103 Ashwood Ct N
- 213 Baron Ct
- 318 Eagle Ct
- 104 Willow Trace
- 32 Bay Cove Dr
- 529 Halley Way
- 377 Summer Hill Cir Unit 5
- 371 Summer Hill Cir Unit 5
- 805 Lorraine Ln
- 809 Lorraine Ln
- 525 Halley Way Unit 5
- 813 Lorraine Ln Unit 4
- 801 Lorraine Ln
- 532 Halley Way Unit 5
- 526 Halley Way Unit 5
- 536 Halley Way
- 0 Lorraine Ln Unit 7391925
- 0 Lorraine Ln Unit 7335188
- 521 Halley Way Unit 5
- 817 Lorraine Ln
- 522 Halley Way
- 378 Summer Hill Cir
- 374 Summer Hill Cir
- 821 Lorraine Ln
- 517 Halley Way Unit 5