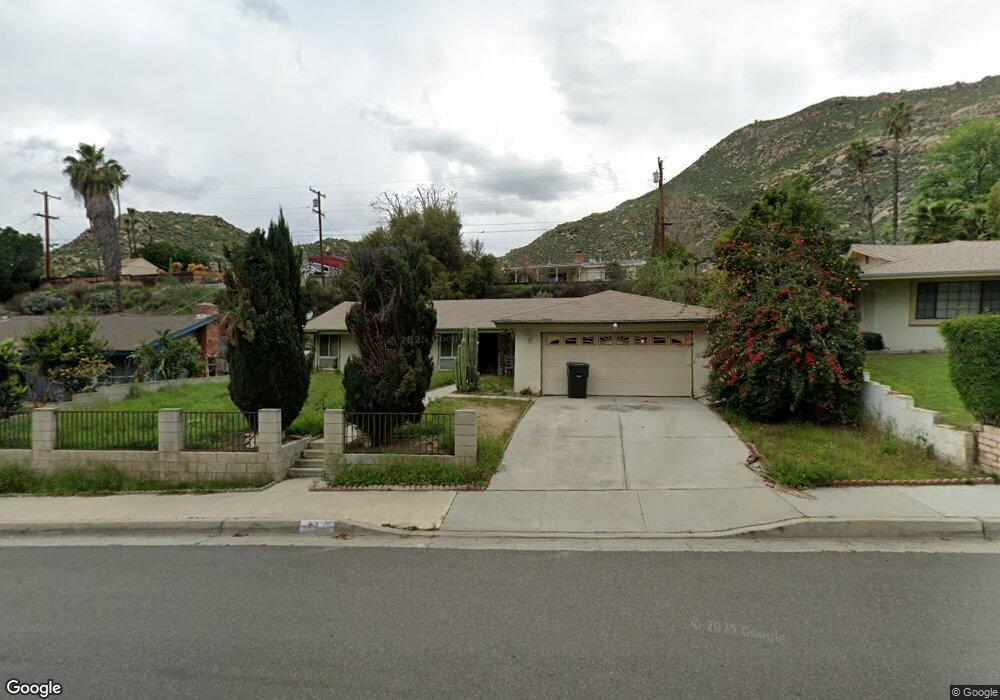
533 Spruce St Riverside, CA 92507
University NeighborhoodEstimated Value: $545,189 - $575,000
3
Beds
2
Baths
1,364
Sq Ft
$410/Sq Ft
Est. Value
About This Home
This home is located at 533 Spruce St, Riverside, CA 92507 and is currently estimated at $558,797, approximately $409 per square foot. 533 Spruce St is a home located in Riverside County with nearby schools including Highland Elementary, University Heights Middle School, and John W. North High School.
Ownership History
Date
Name
Owned For
Owner Type
Purchase Details
Closed on
Dec 17, 2007
Sold by
Brooks Lillian V
Bought by
Brooks Lillian and Horton Asa E
Current Estimated Value
Home Financials for this Owner
Home Financials are based on the most recent Mortgage that was taken out on this home.
Original Mortgage
$331,905
Interest Rate
6.2%
Mortgage Type
Stand Alone Refi Refinance Of Original Loan
Purchase Details
Closed on
Feb 28, 2003
Sold by
Brooks Lillian V and Brooks Lillian
Bought by
Brooks Lillian
Home Financials for this Owner
Home Financials are based on the most recent Mortgage that was taken out on this home.
Original Mortgage
$130,000
Interest Rate
11.2%
Mortgage Type
Purchase Money Mortgage
Create a Home Valuation Report for This Property
The Home Valuation Report is an in-depth analysis detailing your home's value as well as a comparison with similar homes in the area
Home Values in the Area
Average Home Value in this Area
Purchase History
| Date | Buyer | Sale Price | Title Company |
|---|---|---|---|
| Brooks Lillian | -- | Ticor Title | |
| Brooks Lillian | -- | First American Title |
Source: Public Records
Mortgage History
| Date | Status | Borrower | Loan Amount |
|---|---|---|---|
| Closed | Brooks Lillian | $331,905 | |
| Closed | Brooks Lillian | $130,000 |
Source: Public Records
Tax History
| Year | Tax Paid | Tax Assessment Tax Assessment Total Assessment is a certain percentage of the fair market value that is determined by local assessors to be the total taxable value of land and additions on the property. | Land | Improvement |
|---|---|---|---|---|
| 2025 | $2,003 | $187,613 | $56,276 | $131,337 |
| 2023 | $2,003 | $180,330 | $54,092 | $126,238 |
| 2022 | $1,955 | $176,795 | $53,032 | $123,763 |
| 2021 | $1,940 | $173,330 | $51,993 | $121,337 |
| 2020 | $1,925 | $171,553 | $51,460 | $120,093 |
| 2019 | $1,888 | $168,190 | $50,451 | $117,739 |
| 2018 | $1,850 | $164,893 | $49,463 | $115,430 |
| 2017 | $1,817 | $161,661 | $48,494 | $113,167 |
| 2016 | $1,702 | $158,493 | $47,544 | $110,949 |
| 2015 | $1,676 | $156,115 | $46,831 | $109,284 |
| 2014 | $1,658 | $153,059 | $45,914 | $107,145 |
Source: Public Records
Map
Nearby Homes
- 3085 Flanders Rd
- 587 W Blaine St
- 461 W Blaine St
- 3314 Celeste Dr
- 895 Huston Dr
- 2275 Quartz Place
- 3415 Valencia Hill Dr
- 2005 Mt Vernon Ave
- 1065 Bascomb Dr
- 1050 Athena Ct
- 138 Green Oaks Dr
- 2935 Galaxie Heights Rd
- 230 E Blaine St
- 3000 Galaxie Rd
- 3160 Terrace Dr
- 1110 W Blaine St Unit 102
- 1130 W Blaine St Unit 204
- 1168 Athena Ct
- 1142 W Blaine St Unit 201
- 1313 Massachusetts Ave Unit 201
- 541 Spruce St
- 525 Spruce St
- 2555 Flanders Rd
- 553 Spruce St
- 2563 Flanders Rd
- 2549 Flanders Rd
- 517 Spruce St
- 536 Spruce St
- 528 Spruce St
- 2571 Flanders Rd
- 548 Spruce St
- 561 Spruce St
- 518 Spruce St
- 2541 Flanders Rd
- 511 Spruce St
- 556 Spruce St
- 512 Spruce St
- 2554 Flanders Rd
- 525 Glenhill Dr
- 2558 Flanders Rd
Your Personal Tour Guide
Ask me questions while you tour the home.