5331 NW 57th Ave Johnston, IA 50131
East Johnston NeighborhoodEstimated Value: $262,000 - $1,502,000
--
Bed
12
Baths
9,840
Sq Ft
$107/Sq Ft
Est. Value
About This Home
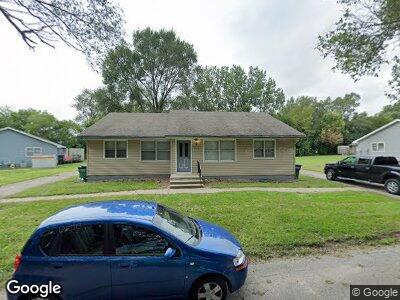
This home is located at 5331 NW 57th Ave, Johnston, IA 50131 and is currently estimated at $1,054,948, approximately $107 per square foot. 5331 NW 57th Ave is a home located in Polk County with nearby schools including Lawson Elementary School, Johnston Middle School, and Summit Middle School.
Ownership History
Date
Name
Owned For
Owner Type
Purchase Details
Closed on
Mar 18, 2020
Sold by
Trails End Investment Lc Llc
Bought by
Trails End Investments Lc
Current Estimated Value
Home Financials for this Owner
Home Financials are based on the most recent Mortgage that was taken out on this home.
Original Mortgage
$980,000
Interest Rate
3.4%
Mortgage Type
Future Advance Clause Open End Mortgage
Purchase Details
Closed on
Apr 30, 2004
Sold by
Lewis Jerald R
Bought by
Trails End Investment Lc
Home Financials for this Owner
Home Financials are based on the most recent Mortgage that was taken out on this home.
Original Mortgage
$803,000
Interest Rate
5.5%
Mortgage Type
Purchase Money Mortgage
Purchase Details
Closed on
Jan 4, 2002
Sold by
Barnes Michael D and Barnes Evie J
Bought by
Lewis Jerald R
Home Financials for this Owner
Home Financials are based on the most recent Mortgage that was taken out on this home.
Original Mortgage
$660,579
Interest Rate
9%
Mortgage Type
Land Contract Argmt. Of Sale
Create a Home Valuation Report for This Property
The Home Valuation Report is an in-depth analysis detailing your home's value as well as a comparison with similar homes in the area
Home Values in the Area
Average Home Value in this Area
Purchase History
| Date | Buyer | Sale Price | Title Company |
|---|---|---|---|
| Trails End Investments Lc | -- | None Available | |
| Trails End Investment Lc | $814,500 | -- | |
| Lewis Jerald R | $710,579 | -- |
Source: Public Records
Mortgage History
| Date | Status | Borrower | Loan Amount |
|---|---|---|---|
| Open | Trails End Investments Lc | $790,000 | |
| Closed | Trails End Investments Lc | $980,000 | |
| Previous Owner | Trails End Investments Lc | $693,129 | |
| Previous Owner | Trails End Investment Lc | $803,000 | |
| Previous Owner | Lewis Jerald R | $660,579 |
Source: Public Records
Tax History Compared to Growth
Tax History
| Year | Tax Paid | Tax Assessment Tax Assessment Total Assessment is a certain percentage of the fair market value that is determined by local assessors to be the total taxable value of land and additions on the property. | Land | Improvement |
|---|---|---|---|---|
| 2024 | $20,450 | $1,219,300 | $153,000 | $1,066,300 |
| 2023 | $20,652 | $1,219,300 | $153,000 | $1,066,300 |
| 2022 | $23,568 | $1,083,100 | $153,000 | $930,100 |
| 2021 | $22,216 | $1,083,100 | $153,000 | $930,100 |
| 2020 | $22,216 | $984,300 | $153,000 | $831,300 |
| 2019 | $22,004 | $984,300 | $153,000 | $831,300 |
| 2018 | $21,446 | $927,400 | $153,000 | $774,400 |
| 2017 | $20,456 | $927,400 | $153,000 | $774,400 |
Source: Public Records
Map
Nearby Homes
- 5553 Kenton Ln
- 6735 Rynor St
- 5125 NW 55th Ave
- 5558 Boston Ct
- 5420 NW 55th Ave
- 5928 NW 50th St
- 6024 Pine Ridge St
- 5909 Village Cir
- 5926 Village Cir
- 5210 NW 62nd Ave
- 6109 NW 49th St
- 6106 Pinewood Ct
- 6018 Terrace Dr Unit 4
- 6196 Terrace Dr Unit 2
- 6172 Terrace Dr Unit 14
- 6295 NW 54th Ct
- 4906 Prairie Place
- 5180 NW 64th Place
- 4803 Sunshine Cir
- 6730 Ceres Cir
- 5331 NW 57th Ave
- 5377 NW 57th Ave
- 5317 NW 57th Ave
- Lot 4 Millers Meadow
- 5285 NW 57th Ave
- 5759 NW 54th Ct
- 5385 NW 57th Ave
- 000 NW 57th Ave
- 5265 NW 57th Ave
- 5733 NW 54th Ct
- 5763 NW 54th Ct
- Lot 3 Millers Meadow
- 5255 NW 57th Ave
- 5777 NW 54th Ct
- 5393 NW 57th Ave
- 5245 NW 57th Ave
- 5300 NW 57th Ave
- 5210 NW 57th Ave
- 5410 NW 57th Ave
- 5736 NW 54th Ct