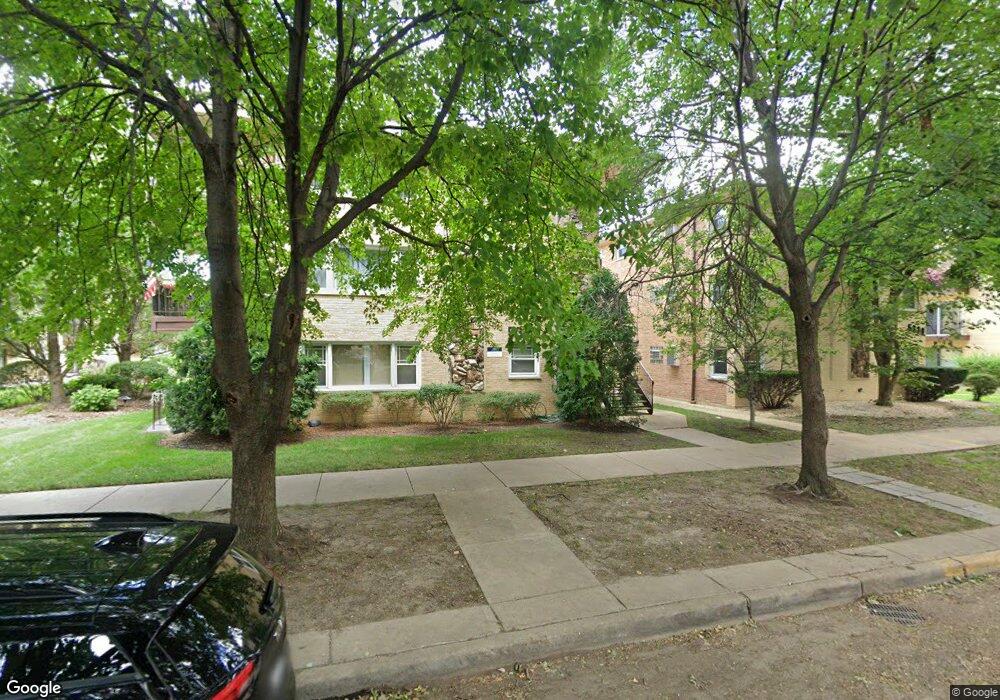
5332 W Windsor Ave Unit 1E Chicago, IL 60630
Jefferson Park NeighborhoodEstimated Value: $174,161 - $242,000
--
Bed
--
Bath
--
Sq Ft
0.85
Acres
About This Home
This home is located at 5332 W Windsor Ave Unit 1E, Chicago, IL 60630 and is currently estimated at $216,040. 5332 W Windsor Ave Unit 1E is a home located in Cook County with nearby schools including Portage Park Elementary School, Schurz High School, and St John Lutheran School.
Ownership History
Date
Name
Owned For
Owner Type
Purchase Details
Closed on
Jun 14, 2010
Sold by
Reczkowski Stanislaw
Bought by
Reczkowska Aneta
Current Estimated Value
Purchase Details
Closed on
Jul 19, 2001
Sold by
Sak Katarzyna and Sak Kathy
Bought by
Reczkowski Stanislaw
Home Financials for this Owner
Home Financials are based on the most recent Mortgage that was taken out on this home.
Original Mortgage
$89,000
Interest Rate
7.25%
Purchase Details
Closed on
May 10, 2001
Sold by
Burrell Dean R
Bought by
Sak Kathy
Purchase Details
Closed on
Jun 27, 1996
Sold by
Janowiak Emily A
Bought by
Burrell Dean R
Home Financials for this Owner
Home Financials are based on the most recent Mortgage that was taken out on this home.
Original Mortgage
$71,900
Interest Rate
8.27%
Create a Home Valuation Report for This Property
The Home Valuation Report is an in-depth analysis detailing your home's value as well as a comparison with similar homes in the area
Home Values in the Area
Average Home Value in this Area
Purchase History
| Date | Buyer | Sale Price | Title Company |
|---|---|---|---|
| Reczkowska Aneta | -- | Saturn | |
| Reczkowski Stanislaw | $124,000 | -- | |
| Sak Kathy | $119,000 | -- | |
| Burrell Dean R | $80,000 | Attorneys Natl Title Network |
Source: Public Records
Mortgage History
| Date | Status | Borrower | Loan Amount |
|---|---|---|---|
| Previous Owner | Reczkowski Stanislaw | $89,000 | |
| Previous Owner | Burrell Dean R | $71,900 |
Source: Public Records
Tax History Compared to Growth
Tax History
| Year | Tax Paid | Tax Assessment Tax Assessment Total Assessment is a certain percentage of the fair market value that is determined by local assessors to be the total taxable value of land and additions on the property. | Land | Improvement |
|---|---|---|---|---|
| 2024 | $1,833 | $15,102 | $2,958 | $12,144 |
| 2023 | $1,765 | $12,000 | $2,366 | $9,634 |
| 2022 | $1,765 | $12,000 | $2,366 | $9,634 |
| 2021 | $1,744 | $11,999 | $2,366 | $9,633 |
| 2020 | $1,461 | $9,655 | $1,225 | $8,430 |
| 2019 | $1,478 | $10,784 | $1,225 | $9,559 |
| 2018 | $1,452 | $10,784 | $1,225 | $9,559 |
| 2017 | $1,735 | $11,432 | $1,098 | $10,334 |
| 2016 | $1,791 | $11,432 | $1,098 | $10,334 |
| 2015 | $1,615 | $11,432 | $1,098 | $10,334 |
| 2014 | $1,689 | $11,664 | $1,014 | $10,650 |
| 2013 | $1,644 | $11,664 | $1,014 | $10,650 |
Source: Public Records
Map
Nearby Homes
- 5330 W Windsor Ave Unit 3I
- 5352 W Sunnyside Ave
- 5416 W Windsor Ave Unit 1N
- 5516 W Windsor Ave Unit 2M
- 5354 W Montrose Ave
- 5401 W Montrose Ave
- 4656 N Leamington Ave
- 5221 W Montrose Ave
- 4501 N Central Ave Unit 301
- 5501 W Lawrence Ave Unit 3C
- 5062 W Agatite Ave Unit 3
- 5253 W Cullom Ave
- 5043 W Sunnyside Ave
- 4648 N Lawler Ave
- 5410 W Hutchinson St
- 4631 N Lawler Ave
- 5036 W Pensacola Ave Unit 309
- 5716 W Eastwood Ave
- 4501 N Lavergne Ave
- 5710 W Leland Ave
- 5332 W Windsor Ave Unit 2B
- 5332 W Windsor Ave Unit 3E
- 5332 W Windsor Ave Unit 3B
- 5332 W Windsor Ave Unit 2A
- 5332 W Windsor Ave Unit 3A
- 5332 W Windsor Ave Unit 3F
- 5332 W Windsor Ave Unit 1B
- 5332 W Windsor Ave Unit 2F
- 5332 W Windsor Ave Unit 2D
- 5332 W Windsor Ave Unit 1F
- 5332 W Windsor Ave Unit 2C
- 5332 W Windsor Ave Unit 3D
- 5332 W Windsor Ave Unit 3C
- 5332 W Windsor Ave Unit 2E
- 5332 W Windsor Ave Unit 1A
- 5332 W Windsor Ave Unit U3E
- 5330 W Windsor Ave Unit 2I
- 5330 W Windsor Ave Unit 1I
- 5330 W Windsor Ave Unit 3J
- 5330 W Windsor Ave Unit 1J