$250,000 - $370,000
RENTED MAY 9, 2025

5353 Institute Ln Unit 22 Houston, TX 77005

Museum Park Neighborhood
2 Beds
2 Baths
1,105 Sq Ft
$267 Price per Sq Ft

About This Home

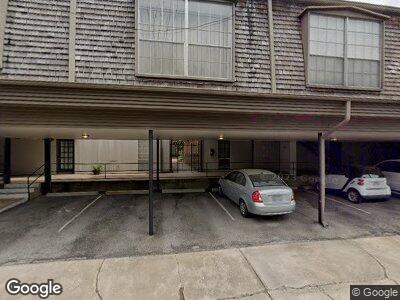
A rare gem located in the museum district, this 2-bed 2-bath is the perfect home for you. Within walking distance of the Museum District, Herman Park, the Medical Center, Rice University, and restaurants. All utilities are included! A must see! Room sizes are approximated. Landlord open to long term and short term rentals. Occupied Home, Accompanied Showings, Available May 15th.

Ownership History

Date Name Owned For Owner Type

Purchase Details

Closed on
Sep 11, 2024
Sold by
Lema Properties Lp
Bought by
Rvs Blanc Llc
Current Estimated Value
$294,807

Purchase Details

Closed on
Dec 3, 2021
Sold by
Elsham Group Llc
Bought by
Lema Properties Lp

Purchase Details

Closed on
Apr 23, 2014
Sold by
Fry Andrew and Fry Angelica
Bought by
The Elsham Group Llc

Purchase Details

Closed on
Apr 8, 2013
Sold by
Cox Jan W and Estate Of Jane W Elioseff
Bought by
Fry Andrew and Fry Angelica

Purchase Details

Closed on
Feb 1, 1999
Sold by
January Katherine R
Bought by
Elioseff Jane W

Range of Values:

Collateral Analytics

Collateral Analytics Collateral Analytics AVMs (Automated Valuation Model) employ a number of statistical approaches combined with neighborhood-specific comparable selection guarantees the most up-to-date and precise valuations.

Not Available

Collateral Analytics does not have data for the current month. Please view the chart for historical values.

ICE

ICE Mortgage Technology ICE Mortgage Technology’s AVM (Automated Valuation Model) is a state-of-the-art online residential property valuation tool that provides a quick and accurate estimate of the value of almost any home in the U.S.

Not Available

ICE Mortgage Technology does not have data for the current month. Please view the chart for historical values.

First American

First American First American Data & Analytics’ next-generation AVM combines unrivaled data assets with a blended ensemble of valuation models to produce highly accurate, reliable valuations you can trust.

Not Available

First American does not have data for the current month. Please view the chart for historical values.

Quantarium

Quantarium Quantarium’s valuation service, repeatedly proven the industry’s most accurate and comprehensive, is supercharged with a self-learning and auto-tuning AI engine that continually becomes smarter and more accurate as it processes daily inputs from the industry’s leading RE data lake.

Not Available

Quantarium does not have data for the current month. Please view the chart for historical values.

Average Value
Not Available
List Price
Sold Price
Create a Home Valuation Report for This Property
The Home Valuation Report is an in-depth analysis detailing your home's value as well as a comparison with similar homes in the area

Home Values in the Area

Source: Public Records

Average Home Value in this Area


Source: Public Records

Purchase History

Date Buyer Sale Price Title Company
Rvs Blanc Llc -- None Listed On Document
Lema Properties Lp -- Chicago Title Company
The Elsham Group Llc -- Chicago Title Co
Fry Andrew -- Charter Title Company
Elioseff Jane W -- --
Source: Public Records

Property History

Date Event Price Change Sq Ft Price
05/09/2025 05/09/25 Rented $2,100 0.0% --
03/01/2025 03/01/25 Under Contract -- -- --
01/15/2025 01/15/25 For Rent $2,100 +2.4% --
04/04/2022 04/04/22 Rented $2,050 +5.1% --
03/07/2022 03/07/22 Under Contract -- -- --
01/11/2022 01/11/22 For Rent $1,950 -- --

Tax History Compared to Growth

Source: Public Records

Tax History

Year Tax Paid Tax Assessment Tax Assessment Total Assessment is a certain percentage of the fair market value that is determined by local assessors to be the total taxable value of land and additions on the property. Land Improvement
2023 $5,624 $261,808 $49,744 $212,064
2022 $4,858 $220,615 $41,917 $178,698
2021 $3,975 $170,555 $32,405 $138,150
2020 $4,137 $170,856 $32,463 $138,393
2019 $4,323 $170,856 $32,463 $138,393
2018 $4,230 $167,181 $31,764 $135,417
2017 $4,227 $167,181 $31,764 $135,417
2016 $4,227 $167,181 $31,764 $135,417
2015 $3,434 $133,566 $25,378 $108,188
2014 $3,434 $133,566 $25,378 $108,188
Source: Public Records

Agents Affiliated with this Home

  • Section Image
See All Agents

Map