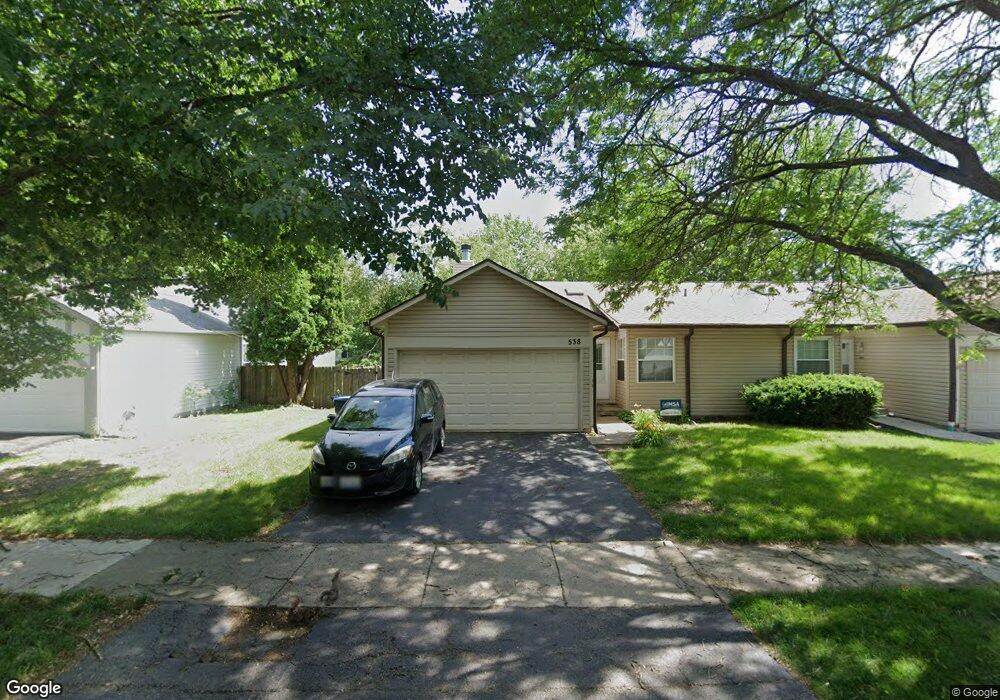
538 Fessler Ave Unit 5 Naperville, IL 60565
Westglen NeighborhoodEstimated Value: $337,000 - $354,228
3
Beds
2
Baths
1,339
Sq Ft
$260/Sq Ft
Est. Value
About This Home
This home is located at 538 Fessler Ave Unit 5, Naperville, IL 60565 and is currently estimated at $347,807, approximately $259 per square foot. 538 Fessler Ave Unit 5 is a home located in DuPage County with nearby schools including Owen Elementary School, Still Middle School, and Waubonsie Valley High School.
Ownership History
Date
Name
Owned For
Owner Type
Purchase Details
Closed on
Sep 12, 2017
Sold by
Chapman Edward J and Chapman Christine M
Bought by
Zaidi Syed Muhammad Ali
Current Estimated Value
Home Financials for this Owner
Home Financials are based on the most recent Mortgage that was taken out on this home.
Original Mortgage
$154,080
Outstanding Balance
$130,686
Interest Rate
4.5%
Mortgage Type
New Conventional
Estimated Equity
$217,121
Purchase Details
Closed on
May 23, 2003
Sold by
Borso Charles S and Borso Honora E
Bought by
Chapman Edward J and Chapman Christine M
Home Financials for this Owner
Home Financials are based on the most recent Mortgage that was taken out on this home.
Original Mortgage
$158,760
Interest Rate
5.51%
Mortgage Type
Purchase Money Mortgage
Create a Home Valuation Report for This Property
The Home Valuation Report is an in-depth analysis detailing your home's value as well as a comparison with similar homes in the area
Home Values in the Area
Average Home Value in this Area
Purchase History
| Date | Buyer | Sale Price | Title Company |
|---|---|---|---|
| Zaidi Syed Muhammad Ali | -- | First American Title Insuran | |
| Chapman Edward J | $176,500 | First American Title |
Source: Public Records
Mortgage History
| Date | Status | Borrower | Loan Amount |
|---|---|---|---|
| Open | Zaidi Syed Muhammad Ali | $154,080 | |
| Previous Owner | Chapman Edward J | $158,760 |
Source: Public Records
Tax History
| Year | Tax Paid | Tax Assessment Tax Assessment Total Assessment is a certain percentage of the fair market value that is determined by local assessors to be the total taxable value of land and additions on the property. | Land | Improvement |
|---|---|---|---|---|
| 2024 | $5,571 | $89,244 | $23,616 | $65,628 |
| 2023 | $5,362 | $80,190 | $21,220 | $58,970 |
| 2022 | $4,880 | $71,400 | $18,740 | $52,660 |
| 2021 | $4,733 | $68,850 | $18,070 | $50,780 |
| 2020 | $4,726 | $68,850 | $18,070 | $50,780 |
| 2019 | $4,550 | $65,490 | $17,190 | $48,300 |
| 2018 | $4,380 | $61,880 | $16,130 | $45,750 |
| 2017 | $4,266 | $59,780 | $15,580 | $44,200 |
| 2016 | $4,197 | $57,370 | $14,950 | $42,420 |
| 2015 | $4,168 | $54,470 | $14,190 | $40,280 |
| 2014 | $3,742 | $47,210 | $12,200 | $35,010 |
| 2013 | $3,732 | $47,530 | $12,280 | $35,250 |
Source: Public Records
Map
Nearby Homes
- 534 Grimes Ave
- 1033 Emerald Dr
- 316 Hemlock Ln
- 316 Sycamore Dr Unit 11
- 313 W Gartner Rd
- 845 Tulip Ln
- 901 Heathrow Ln
- 1161 Banyon Ct
- 854 Raintree Dr
- 381 Prairie Knoll Dr
- 7S410 Arbor Dr
- 661 Willow Rd
- 707 Thornwood Dr
- 48 Starling Ln
- 731 S River Rd
- 706 S Loomis St Unit D
- 2206 Gleneagles Dr
- 908 Julian Ct
- 616 Driftwood Ct
- 2221 Woodland Cir
- 540 Fessler Ave
- 536 Fessler Ave
- 534 Fessler Ave
- 542 Fessler Ave
- 535 Grimes Ave
- 539 Grimes Ave
- 544 Fessler Ave
- 537 Grimes Ave
- 533 Grimes Ave
- 541 Fessler Ave
- 531 Grimes Ave
- 543 Fessler Ave
- 532 Fessler Ave
- 539 Fessler Ave
- 541 Grimes Ave
- 530 Fessler Ave
- 537 Fessler Ave
- 545 Fessler Ave
- 546 Fessler Ave
- 529 Grimes Ave
Your Personal Tour Guide
Ask me questions while you tour the home.