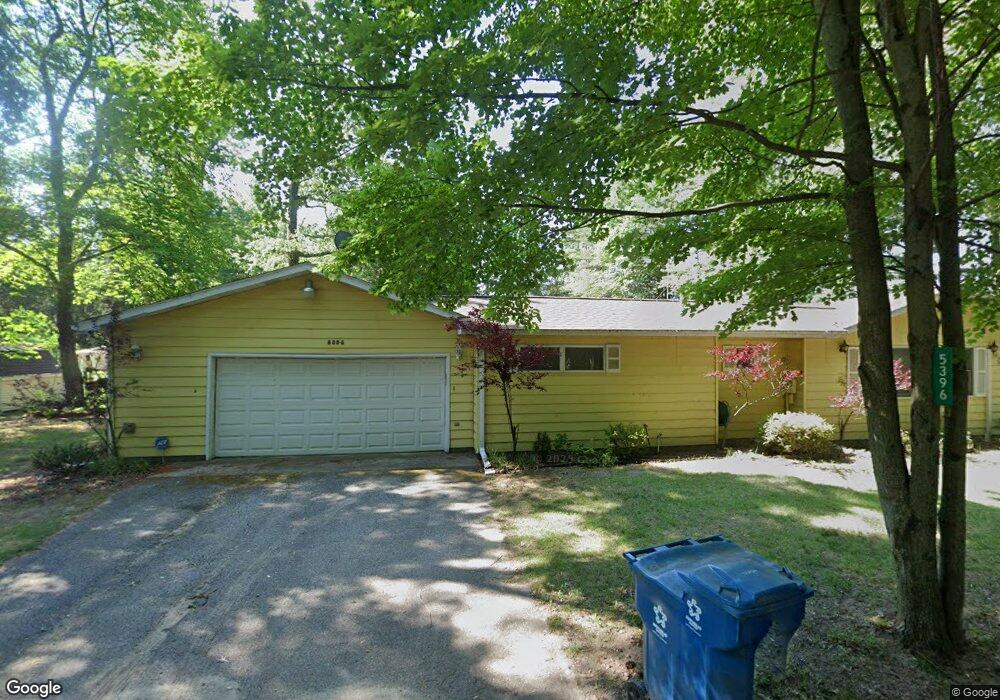
5396 110th Ave Pullman, MI 49450
Estimated Value: $321,000 - $507,073
3
Beds
2
Baths
1,984
Sq Ft
$201/Sq Ft
Est. Value
About This Home
This home is located at 5396 110th Ave, Pullman, MI 49450 and is currently estimated at $399,018, approximately $201 per square foot. 5396 110th Ave is a home located in Allegan County with nearby schools including Fennville Elementary School, Fennville Middle School, and Fennville High School.
Ownership History
Date
Name
Owned For
Owner Type
Purchase Details
Closed on
Jun 25, 2018
Sold by
Yetzke Claiudia
Bought by
Santoro Jennifer Burke and Santoro Philip R
Current Estimated Value
Home Financials for this Owner
Home Financials are based on the most recent Mortgage that was taken out on this home.
Original Mortgage
$125,000
Interest Rate
4.6%
Mortgage Type
New Conventional
Create a Home Valuation Report for This Property
The Home Valuation Report is an in-depth analysis detailing your home's value as well as a comparison with similar homes in the area
Purchase History
| Date | Buyer | Sale Price | Title Company |
|---|---|---|---|
| Santoro Jennifer Burke | -- | Sun Title Agency Of Michigan |
Source: Public Records
Mortgage History
| Date | Status | Borrower | Loan Amount |
|---|---|---|---|
| Closed | Santoro Jennifer Burke | $125,000 |
Source: Public Records
Tax History
| Year | Tax Paid | Tax Assessment Tax Assessment Total Assessment is a certain percentage of the fair market value that is determined by local assessors to be the total taxable value of land and additions on the property. | Land | Improvement |
|---|---|---|---|---|
| 2025 | $6,778 | $228,300 | $115,800 | $112,500 |
| 2024 | $4,733 | $183,100 | $70,200 | $112,900 |
| 2023 | $4,733 | $150,700 | $34,300 | $116,400 |
| 2022 | $4,733 | $131,500 | $31,200 | $100,300 |
| 2020 | $5,157 | $95,600 | $25,400 | $70,200 |
| 2019 | $5,138 | $96,700 | $25,400 | $71,300 |
| 2018 | $0 | $90,400 | $25,400 | $65,000 |
| 2017 | $0 | $97,100 | $25,400 | $71,700 |
| 2016 | $0 | $77,700 | $22,400 | $55,300 |
| 2015 | -- | $77,700 | $22,400 | $55,300 |
| 2014 | -- | $54,000 | $17,200 | $36,800 |
| 2013 | -- | $56,900 | $19,500 | $37,400 |
Source: Public Records
Map
Nearby Homes
- 5396 W 110th Ave
- 5392 110th Ave
- Parcel A W 110th Ave
- 5300 W 110th Ave
- 4852 W 110th Ave
- 48510 W 110th Ave
- 9999 W 110th Ave
- 0 W 110th Ave
- 5397 W 110th Ave
- 4753 W 110th Ave
- 5397 110th Ave
- 5391 110th Ave
- 988 Lakewood St
- 1007 54th St
- 0 54th St
- 1009 54th St
- 984 Lakewood St
- 5381 110th Ave
- 1124 54th St
- V/L 54th St
Your Personal Tour Guide
Ask me questions while you tour the home.