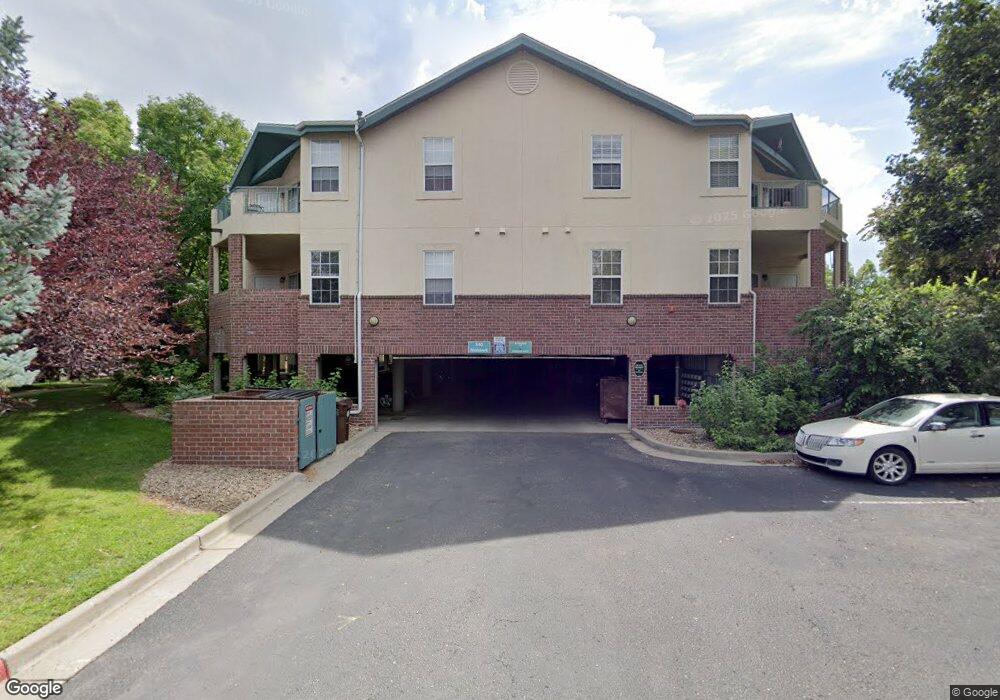
540 Mohawk Dr Unit 15 Boulder, CO 80303
Southeast Boulder NeighborhoodEstimated Value: $516,212 - $556,000
2
Beds
2
Baths
1,111
Sq Ft
$482/Sq Ft
Est. Value
About This Home
This home is located at 540 Mohawk Dr Unit 15, Boulder, CO 80303 and is currently estimated at $535,303, approximately $481 per square foot. 540 Mohawk Dr Unit 15 is a home located in Boulder County with nearby schools including Eisenhower Elementary School, Manhattan Middle School of the Arts & Academics, and Fairview High School.
Ownership History
Date
Name
Owned For
Owner Type
Purchase Details
Closed on
Jan 6, 2016
Sold by
Boyd Carol J
Bought by
3M Rentals Llc
Current Estimated Value
Purchase Details
Closed on
May 19, 2015
Sold by
Gonzalez Gilberto
Bought by
Boyd Carol J
Purchase Details
Closed on
Sep 3, 2002
Sold by
Schweppe Charles H and Schweppe Revocable T Charles H
Bought by
Gonzalez Gilberto
Purchase Details
Closed on
Aug 9, 1999
Sold by
Schweppe Charles H
Bought by
Schweppe Charles H and Charles H Schweppe Revocable Trust
Purchase Details
Closed on
Mar 15, 1999
Sold by
Meadow Venture Ltd Partnership
Bought by
Schweppe Charles H
Home Financials for this Owner
Home Financials are based on the most recent Mortgage that was taken out on this home.
Original Mortgage
$128,222
Interest Rate
7.5%
Create a Home Valuation Report for This Property
The Home Valuation Report is an in-depth analysis detailing your home's value as well as a comparison with similar homes in the area
Home Values in the Area
Average Home Value in this Area
Purchase History
| Date | Buyer | Sale Price | Title Company |
|---|---|---|---|
| 3M Rentals Llc | -- | None Available | |
| Boyd Carol J | $350,000 | Land Title Guarantee Company | |
| Gonzalez Gilberto | $289,000 | First American Heritage Titl | |
| Schweppe Charles H | -- | -- | |
| Schweppe Charles H | $183,174 | -- |
Source: Public Records
Mortgage History
| Date | Status | Borrower | Loan Amount |
|---|---|---|---|
| Previous Owner | Schweppe Charles H | $128,222 |
Source: Public Records
Tax History
| Year | Tax Paid | Tax Assessment Tax Assessment Total Assessment is a certain percentage of the fair market value that is determined by local assessors to be the total taxable value of land and additions on the property. | Land | Improvement |
|---|---|---|---|---|
| 2025 | $3,360 | $39,050 | -- | $39,050 |
| 2024 | $3,360 | $39,050 | -- | $39,050 |
| 2023 | $3,299 | $37,332 | -- | $41,017 |
| 2022 | $3,167 | $33,291 | $0 | $33,291 |
| 2021 | $3,023 | $34,249 | $0 | $34,249 |
| 2020 | $3,004 | $34,513 | $0 | $34,513 |
| 2019 | $2,958 | $34,513 | $0 | $34,513 |
| 2018 | $2,709 | $31,241 | $0 | $31,241 |
| 2017 | $2,624 | $34,538 | $0 | $34,538 |
| 2016 | $2,395 | $27,669 | $0 | $27,669 |
| 2015 | $2,268 | $24,604 | $0 | $24,604 |
| 2014 | $2,115 | $24,604 | $0 | $24,604 |
Source: Public Records
Map
Nearby Homes
- 540 Mohawk Dr Unit 18
- 4475 Laguna Place Unit 206
- 4475 Laguna Place Unit 201
- 4500 Baseline Rd Unit 1208
- 625 Manhattan Place Unit 308
- 4415 Laguna Place Unit 201
- 695 Manhattan Dr Unit 109
- 695 Manhattan Dr Unit 116
- 695 Manhattan Dr Unit 219
- 665 Manhattan Dr Unit 9
- 230 Pawnee Dr
- 600 Manhattan Dr Unit A7
- 600 Manhattan Dr Unit C7
- 4195 Chippewa Dr
- 4521 Navajo Place
- 4800 Osage Dr Unit B-16
- 167 Cherokee Way
- 655 Cree Cir
- 875 Orman Dr
- 130 Cherokee Way
- 540 Mohawk Dr Unit 24
- 540 Mohawk Dr Unit 23
- 540 Mohawk Dr Unit 22
- 540 Mohawk Dr Unit 21
- 540 Mohawk Dr Unit 20
- 540 Mohawk Dr Unit 19
- 540 Mohawk Dr Unit 17
- 540 Mohawk Dr Unit 16
- 540 Mohawk Dr Unit 14
- 540 Mohawk Dr Unit 13
- 540 Mohawk Dr Unit 12
- 540 Mohawk Dr Unit 11
- 540 Mohawk Dr Unit 10
- 540 Mohawk Dr Unit 9
- 540 Mohawk Dr Unit 8
- 540 Mohawk Dr Unit 7
- 540 Mohawk Dr Unit 6
- 540 Mohawk Dr Unit 5
- 540 Mohawk Dr Unit 4
- 540 Mohawk Dr Unit 3
Your Personal Tour Guide
Ask me questions while you tour the home.