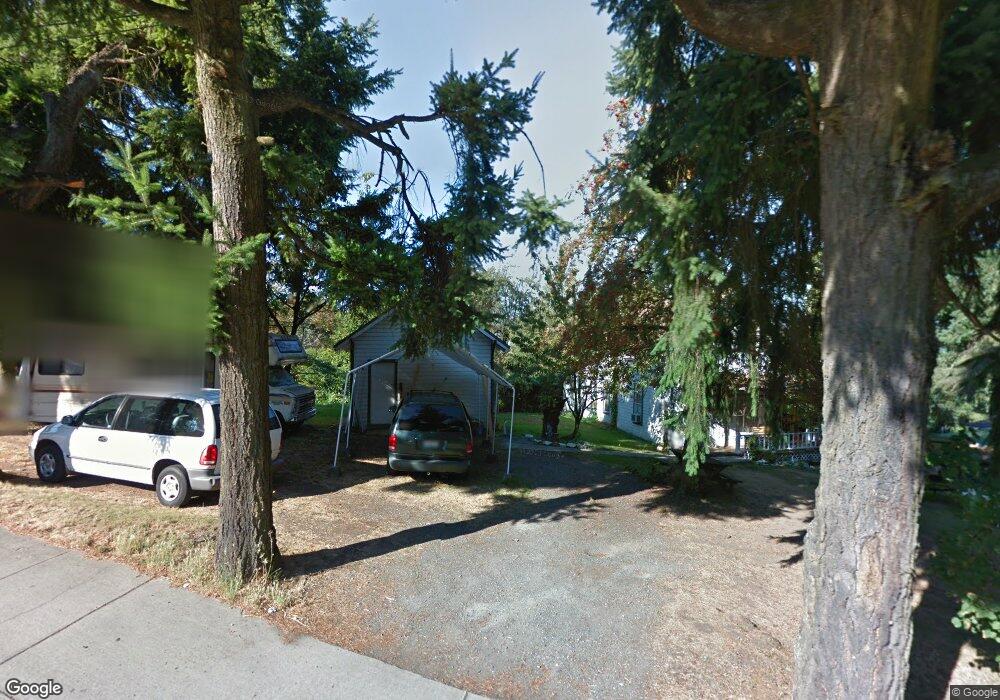
5401 S 4th Ave Everett, WA 98203
Lowell NeighborhoodEstimated Value: $449,707 - $588,000
3
Beds
1
Bath
1,272
Sq Ft
$405/Sq Ft
Est. Value
About This Home
This home is located at 5401 S 4th Ave, Everett, WA 98203 and is currently estimated at $514,677, approximately $404 per square foot. 5401 S 4th Ave is a home with nearby schools including Lowell Elementary School, Evergreen Middle School, and Everett High School.
Ownership History
Date
Name
Owned For
Owner Type
Purchase Details
Closed on
Dec 8, 2021
Sold by
Sheriffs Snohomish County
Bought by
Onewest Bank Na
Current Estimated Value
Purchase Details
Closed on
Aug 14, 2020
Sold by
Estate Of Wayne K Joel
Bought by
Onewest Bank Na
Purchase Details
Closed on
Nov 14, 2018
Sold by
Ten Bridges Llc
Bought by
Joel Scott
Purchase Details
Closed on
Aug 17, 2018
Sold by
Joel Scott
Bought by
Ten Bridges Llc
Purchase Details
Closed on
May 30, 2018
Sold by
The Estate Of Wayne K Joel
Bought by
State Of Washington
Purchase Details
Closed on
Aug 28, 2006
Sold by
Gallagher James A
Bought by
Joel Wayne K and Joel Anna F
Purchase Details
Closed on
May 13, 1996
Sold by
Joel Todd Wayne and Joel Pamela Lorene
Bought by
Joel Wayne K and Joel Anna F
Create a Home Valuation Report for This Property
The Home Valuation Report is an in-depth analysis detailing your home's value as well as a comparison with similar homes in the area
Home Values in the Area
Average Home Value in this Area
Purchase History
| Date | Buyer | Sale Price | Title Company |
|---|---|---|---|
| Onewest Bank Na | $275,000 | None Listed On Document | |
| Onewest Bank Na | $162,639 | None Available | |
| Joel Scott | -- | None Available | |
| Ten Bridges Llc | $2,000 | None Available | |
| State Of Washington | $162,639 | None Available | |
| Joel Wayne K | $5,750 | None Available | |
| Joel Wayne K | -- | Transamerica Title Ins Compa |
Source: Public Records
Tax History
| Year | Tax Paid | Tax Assessment Tax Assessment Total Assessment is a certain percentage of the fair market value that is determined by local assessors to be the total taxable value of land and additions on the property. | Land | Improvement |
|---|---|---|---|---|
| 2026 | $2,777 | $323,900 | $323,900 | -- |
| 2025 | $2,285 | $317,400 | $317,400 | -- |
| 2024 | $2,285 | $264,900 | $264,900 | -- |
| 2023 | $2,736 | $332,000 | $313,800 | $18,200 |
| 2022 | $1,947 | $211,800 | $196,200 | $15,600 |
| 2020 | $2,140 | $189,900 | $178,500 | $11,400 |
| 2019 | $1,782 | $159,100 | $147,800 | $11,300 |
| 2018 | $1,820 | $149,100 | $138,900 | $10,200 |
| 2017 | $2,169 | $177,100 | $107,400 | $69,700 |
| 2016 | $1,796 | $154,100 | $87,200 | $66,900 |
| 2015 | $39 | $144,400 | $85,600 | $58,800 |
| 2013 | $42 | $119,500 | $60,600 | $58,900 |
Source: Public Records
Map
Nearby Homes
- 5310 S 2nd Ave Unit A
- 5431 Broadway
- 5727 Lombard Ave
- 5620 Wetmore Ave
- 5716 Wetmore Ave
- 1501 52nd St SE Unit 1
- 4618 S 3rd Ave
- 4623 31st Ave SE
- 5101 Delaware Ave
- 2323 Ave
- 2323 Lexington Ave
- 6411 Broadway
- 4907 Delaware Ave
- 6606 Lombard Ave Unit 3
- 4733 Carlton Rd
- 5809 Highway Place Unit B304
- 5809 Highway Place Unit A203
- 4309 30th Dr SE
- 2011 Madison St
- 4407 Hoyt Ave Unit ABCD
- 5402 S 3rd Ave
- 5404 S 3rd Ave
- 5310 S 3rd Ave
- 5406 S 3rd Ave
- 5311 S 4th Ave
- 5413 S 4th Ave
- 5320 S 4th Ave
- 5316 S 4th Ave
- 5408 S 3rd Ave
- 5308 S 3rd Ave Unit A&B
- 5308 S 3rd Ave
- 5308 S 3rd Ave Unit B
- 5308 S 3rd Ave Unit A
- 5408 S 4th Ave
- 2527 Lowell Rd
- 5417 S 4th Ave
- 5307 S 4th Ave
- 5307 S 4th Ave Unit A & B
- 5307 S 4th Ave Unit B
- 5416 S 3rd Ave
Your Personal Tour Guide
Ask me questions while you tour the home.