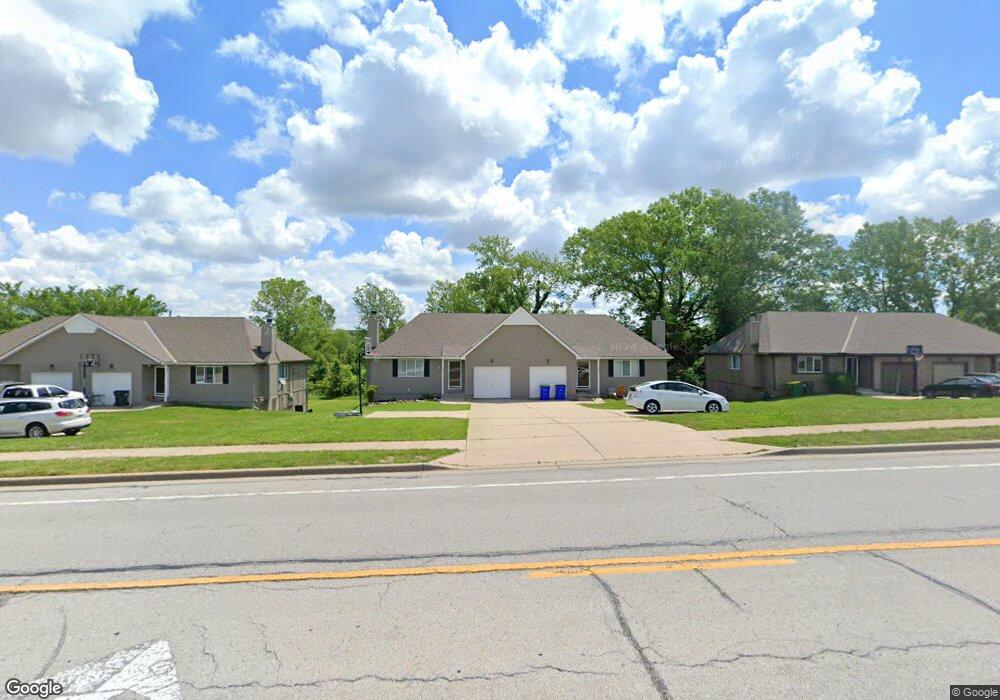
5401 Woodland Rd Shawnee, KS 66218
Estimated Value: $394,000 - $454,954
6
Beds
4
Baths
2,064
Sq Ft
$204/Sq Ft
Est. Value
About This Home
This home is located at 5401 Woodland Rd, Shawnee, KS 66218 and is currently estimated at $421,739, approximately $204 per square foot. 5401 Woodland Rd is a home located in Johnson County with nearby schools including Clear Creek Elementary School, Monticello Trails Middle School, and Mill Valley High School.
Ownership History
Date
Name
Owned For
Owner Type
Purchase Details
Closed on
Mar 14, 2022
Sold by
Khanna and Sanjeev
Bought by
Chintala Chandra Sekhar Reddy and Gorla Srinivasa Reddy
Current Estimated Value
Home Financials for this Owner
Home Financials are based on the most recent Mortgage that was taken out on this home.
Original Mortgage
$292,500
Outstanding Balance
$273,073
Interest Rate
3.85%
Mortgage Type
New Conventional
Estimated Equity
$148,666
Purchase Details
Closed on
Jan 22, 2014
Sold by
Kps Associates Lp
Bought by
Khanna Alka and Khanna Sanjeev
Purchase Details
Closed on
Oct 31, 2007
Sold by
Khanna Alka and Khanna Sanjeev
Bought by
Kps Associates Lp
Purchase Details
Closed on
Nov 3, 2005
Sold by
Waters John C
Bought by
Khanna Alka
Purchase Details
Closed on
Nov 23, 2004
Sold by
Waters Shari L
Bought by
Waters John C
Create a Home Valuation Report for This Property
The Home Valuation Report is an in-depth analysis detailing your home's value as well as a comparison with similar homes in the area
Home Values in the Area
Average Home Value in this Area
Purchase History
| Date | Buyer | Sale Price | Title Company |
|---|---|---|---|
| Chintala Chandra Sekhar Reddy | -- | Continental Title Company | |
| Khanna Alka | -- | Alpha Title Llc | |
| Kps Associates Lp | -- | Accommodation | |
| Khanna Alka | -- | Cbkc Title And Escrow Llc | |
| Waters John C | -- | Cbkc Title & Escrow Llc |
Source: Public Records
Mortgage History
| Date | Status | Borrower | Loan Amount |
|---|---|---|---|
| Open | Chintala Chandra Sekhar Reddy | $292,500 |
Source: Public Records
Tax History Compared to Growth
Tax History
| Year | Tax Paid | Tax Assessment Tax Assessment Total Assessment is a certain percentage of the fair market value that is determined by local assessors to be the total taxable value of land and additions on the property. | Land | Improvement |
|---|---|---|---|---|
| 2024 | $5,521 | $46,885 | $7,499 | $39,386 |
| 2023 | $5,345 | $44,850 | $5,766 | $39,084 |
| 2022 | $5,095 | $41,860 | $5,766 | $36,094 |
| 2021 | $4,649 | $36,651 | $5,012 | $31,639 |
| 2020 | $4,431 | $34,581 | $5,012 | $29,569 |
| 2019 | $4,422 | $34,006 | $5,012 | $28,994 |
| 2018 | $4,323 | $32,936 | $5,012 | $27,924 |
| 2017 | $4,188 | $31,108 | $5,012 | $26,096 |
| 2016 | $4,064 | $29,797 | $5,012 | $24,785 |
| 2015 | $3,900 | $28,359 | $5,012 | $23,347 |
| 2013 | -- | $27,002 | $5,012 | $21,990 |
Source: Public Records
Map
Nearby Homes
- 5405 Lakecrest Dr
- 5311 Brownridge Dr
- 21217 W 55th Terrace
- 5015 Millbrook St
- 5817 Millbrook St
- 21309 W 56th St
- 5725 Marion St
- 21315 W 56th St
- 5307 Noble St
- 21624 W 53rd Terrace
- 5900 Redbud St
- 21408 W 50th St
- 21804 W 52nd Terrace
- 21222 W 48th St
- 4754 Lakecrest Dr
- 5206 Round Prairie St
- 6046 Redbud St
- 6031 Lakecrest Dr
- 5402 Roundtree St
- 4713 Lone Elm
- 5333 Woodland Rd
- 5407 Woodland Rd
- 5327 Woodland Dr
- 5413 Woodland Rd
- 5327 Woodland Rd
- 5321 Woodland Rd
- 5347 Millbrook St
- 5333 Millbrook St
- 5319 Woodland Dr
- 5319 Woodland Rd
- 20600 Johnson Dr
- 5323 Millbrook St
- 20807 W 54th St
- 5313 Woodland Rd
- 5326 Millbrook St
- 5309 Millbrook St
- 20817 W 54th St
- 5307 Woodland Rd
- 5312 Millbrook St
- 5403 Woodstock St