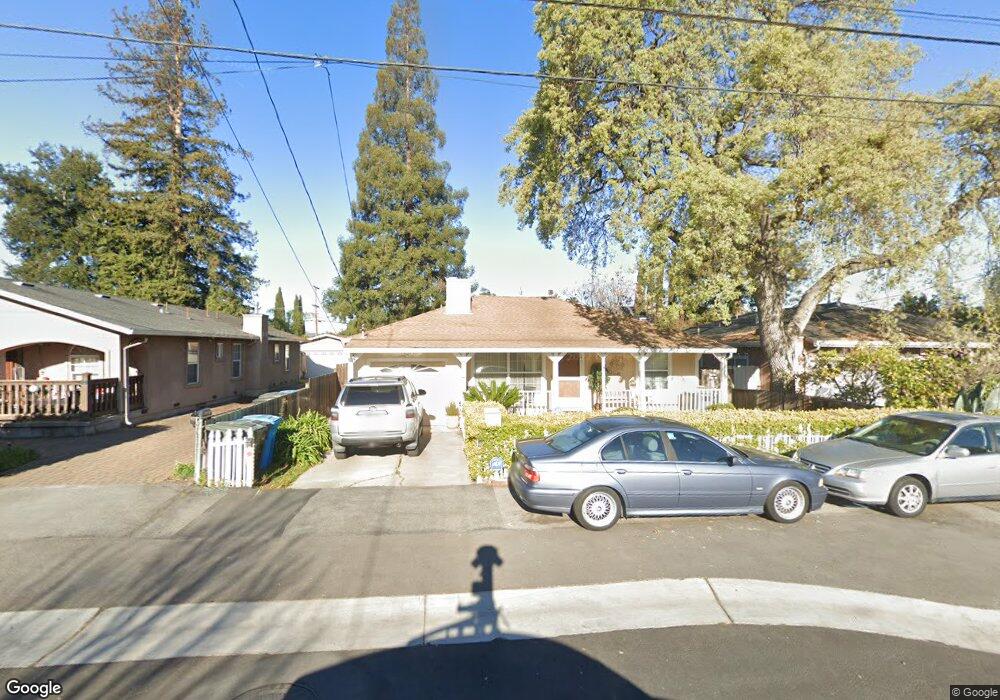
541 7th Ave Menlo Park, CA 94025
North Fair Oaks NeighborhoodEstimated Value: $1,391,000 - $1,936,000
3
Beds
2
Baths
1,570
Sq Ft
$1,052/Sq Ft
Est. Value
About This Home
This home is located at 541 7th Ave, Menlo Park, CA 94025 and is currently estimated at $1,650,862, approximately $1,051 per square foot. 541 7th Ave is a home located in San Mateo County with nearby schools including Garfield Elementary School, John F. Kennedy Middle School, and Menlo-Atherton High School.
Ownership History
Date
Name
Owned For
Owner Type
Purchase Details
Closed on
Nov 9, 1998
Sold by
Rosing Haruko M
Bought by
Munguia Hector and Munguia Julieta
Current Estimated Value
Home Financials for this Owner
Home Financials are based on the most recent Mortgage that was taken out on this home.
Original Mortgage
$45,000
Outstanding Balance
$9,676
Interest Rate
6.42%
Mortgage Type
Credit Line Revolving
Estimated Equity
$1,641,186
Create a Home Valuation Report for This Property
The Home Valuation Report is an in-depth analysis detailing your home's value as well as a comparison with similar homes in the area
Home Values in the Area
Average Home Value in this Area
Purchase History
| Date | Buyer | Sale Price | Title Company |
|---|---|---|---|
| Munguia Hector | $300,000 | Old Republic Title Ins Compa | |
| Rosing Haruko M | -- | Old Republic Title Ins Compa |
Source: Public Records
Mortgage History
| Date | Status | Borrower | Loan Amount |
|---|---|---|---|
| Open | Rosing Haruko M | $45,000 | |
| Open | Munguia Hector | $225,000 |
Source: Public Records
Tax History
| Year | Tax Paid | Tax Assessment Tax Assessment Total Assessment is a certain percentage of the fair market value that is determined by local assessors to be the total taxable value of land and additions on the property. | Land | Improvement |
|---|---|---|---|---|
| 2025 | $7,123 | $507,242 | $235,144 | $272,098 |
| 2023 | $7,123 | $487,548 | $226,014 | $261,534 |
| 2022 | $6,640 | $477,990 | $221,583 | $256,407 |
| 2021 | $6,559 | $468,620 | $217,239 | $251,381 |
| 2020 | $6,460 | $463,816 | $215,012 | $248,804 |
| 2019 | $6,378 | $454,724 | $210,797 | $243,927 |
| 2018 | $6,142 | $445,809 | $206,664 | $239,145 |
| 2017 | $5,900 | $437,069 | $202,612 | $234,457 |
| 2016 | $5,727 | $428,501 | $198,640 | $229,861 |
| 2015 | $5,510 | $422,067 | $195,657 | $226,410 |
| 2014 | $5,392 | $413,801 | $191,825 | $221,976 |
Source: Public Records
Map
Nearby Homes
- 548 6th Ave
- 432 8th Ave
- 746 6th Ave
- 732 4th Ave
- 313 6th Ave
- 642 14th Ave
- 74 Middlefield Rd
- 545 Hampshire Ave
- 754 15th Ave
- 976 2nd Ave
- 3354 Page St
- 85 Rittenhouse Ave
- 55 Irving Ave
- 3234 Hoover St
- 1049 Haven Ave
- 2053 E Bayshore Rd Unit 55
- 371 E Oakwood Blvd
- 1064 15th Ave
- 3015 E Bayshore Rd Unit 169
- 3015 E Bayshore Rd Unit 316
Your Personal Tour Guide
Ask me questions while you tour the home.