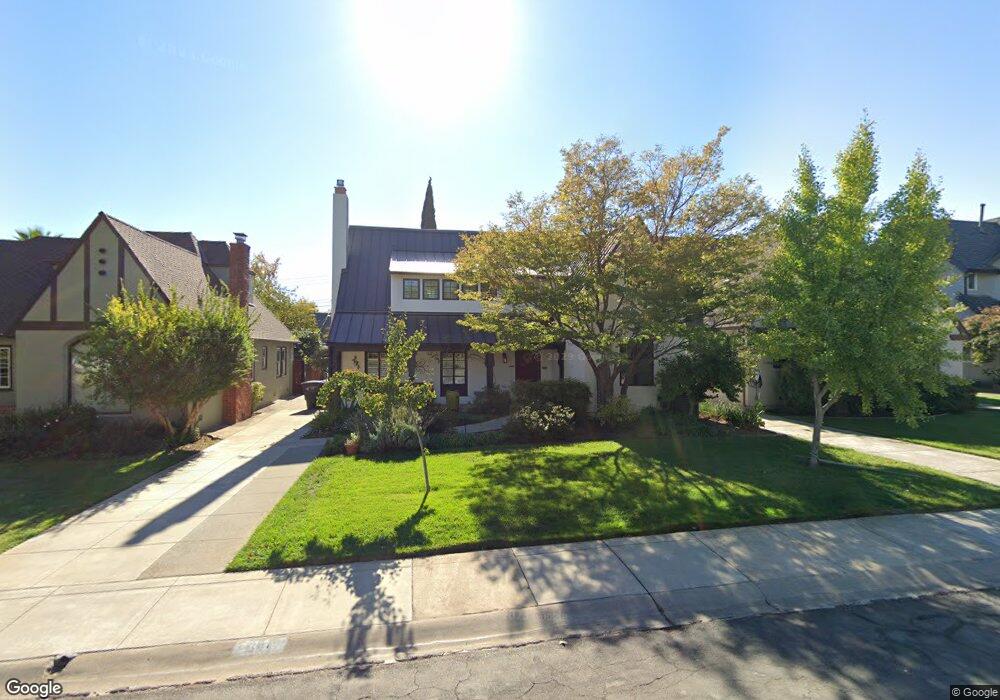
541 Pico Way Sacramento, CA 95819
East Sacramento NeighborhoodEstimated Value: $633,000 - $1,078,000
4
Beds
3
Baths
2,263
Sq Ft
$412/Sq Ft
Est. Value
About This Home
This home is located at 541 Pico Way, Sacramento, CA 95819 and is currently estimated at $932,233, approximately $411 per square foot. 541 Pico Way is a home located in Sacramento County with nearby schools including Caleb Greenwood Elementary, Miwok Middle School, and Hiram W. Johnson High School.
Ownership History
Date
Name
Owned For
Owner Type
Purchase Details
Closed on
Aug 7, 2018
Sold by
Scanlon Diane C and Scanlon Revocable Trust
Bought by
Scanlon Diane C and Survivor S Trust
Current Estimated Value
Purchase Details
Closed on
Jan 15, 2002
Sold by
Scanlon Jack R
Bought by
Scanlon Jack R and Scanlon Diane C
Purchase Details
Closed on
Jul 14, 1997
Sold by
Rapozo Martin James and Rapozo Katheryn R
Bought by
Scanlon Jack
Purchase Details
Closed on
Aug 30, 1996
Sold by
Richardson Rapozo Martin James and Richardson Katie
Bought by
Rapozo Martin J and Rapozo Katheryn R
Create a Home Valuation Report for This Property
The Home Valuation Report is an in-depth analysis detailing your home's value as well as a comparison with similar homes in the area
Home Values in the Area
Average Home Value in this Area
Purchase History
| Date | Buyer | Sale Price | Title Company |
|---|---|---|---|
| Scanlon Diane C | -- | None Available | |
| Scanlon Jack R | -- | -- | |
| Scanlon Jack | $455,000 | Stewart Title | |
| Rapozo Martin J | -- | -- |
Source: Public Records
Tax History Compared to Growth
Tax History
| Year | Tax Paid | Tax Assessment Tax Assessment Total Assessment is a certain percentage of the fair market value that is determined by local assessors to be the total taxable value of land and additions on the property. | Land | Improvement |
|---|---|---|---|---|
| 2025 | $6,648 | $574,805 | $127,722 | $447,083 |
| 2024 | $6,648 | $563,535 | $125,218 | $438,317 |
| 2023 | $6,490 | $552,486 | $122,763 | $429,723 |
| 2022 | $6,380 | $541,654 | $120,356 | $421,298 |
| 2021 | $6,075 | $531,035 | $117,997 | $413,038 |
| 2020 | $6,127 | $525,591 | $116,788 | $408,803 |
| 2019 | $5,996 | $515,287 | $114,499 | $400,788 |
| 2018 | $5,838 | $505,184 | $112,254 | $392,930 |
| 2017 | $5,757 | $495,279 | $110,053 | $385,226 |
| 2016 | $5,660 | $485,569 | $107,896 | $377,673 |
| 2015 | $5,564 | $478,276 | $106,276 | $372,000 |
| 2014 | $5,410 | $468,909 | $104,195 | $364,714 |
Source: Public Records
Map
Nearby Homes