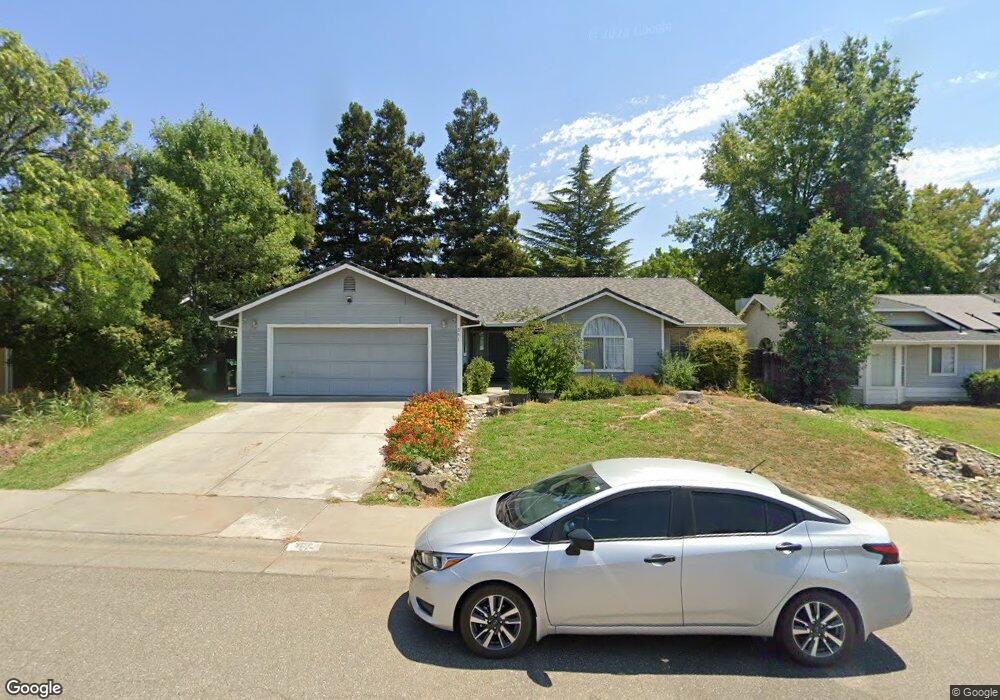
541 Stanmar Dr Corning, CA 96021
Estimated Value: $361,762 - $428,000
4
Beds
2
Baths
1,671
Sq Ft
$239/Sq Ft
Est. Value
About This Home
This home is located at 541 Stanmar Dr, Corning, CA 96021 and is currently estimated at $399,941, approximately $239 per square foot. 541 Stanmar Dr is a home located in Tehama County with nearby schools including Olive View Elementary School, Maywood Middle School, and Corning High School.
Ownership History
Date
Name
Owned For
Owner Type
Purchase Details
Closed on
Feb 23, 2023
Sold by
Bob And Susan Orange May 2012 Trust
Bought by
Martinez Maricela Resendiz and Martinez-Muniz Juan Luis
Current Estimated Value
Home Financials for this Owner
Home Financials are based on the most recent Mortgage that was taken out on this home.
Original Mortgage
$312,550
Outstanding Balance
$302,743
Interest Rate
6.33%
Mortgage Type
New Conventional
Estimated Equity
$97,198
Purchase Details
Closed on
Mar 26, 2018
Sold by
Harmor Elizabeth A
Bought by
Harmor Elizabeth Ann and The Elizabeth Ann Harmor Trust
Purchase Details
Closed on
May 18, 2012
Sold by
Orange Susan E
Bought by
Orange Bob Alan and Orange Susan Esther
Purchase Details
Closed on
Nov 11, 2009
Sold by
Harmor Elizabeth A and Orange Susan E
Bought by
Harmor Elizabeth A and Orange Susan E
Create a Home Valuation Report for This Property
The Home Valuation Report is an in-depth analysis detailing your home's value as well as a comparison with similar homes in the area
Home Values in the Area
Average Home Value in this Area
Purchase History
| Date | Buyer | Sale Price | Title Company |
|---|---|---|---|
| Martinez Maricela Resendiz | $329,000 | Placer Title | |
| Harmor Elizabeth Ann | -- | None Available | |
| Orange Bob Alan | -- | None Available | |
| Harmor Elizabeth A | -- | None Available |
Source: Public Records
Mortgage History
| Date | Status | Borrower | Loan Amount |
|---|---|---|---|
| Open | Martinez Maricela Resendiz | $312,550 |
Source: Public Records
Tax History Compared to Growth
Tax History
| Year | Tax Paid | Tax Assessment Tax Assessment Total Assessment is a certain percentage of the fair market value that is determined by local assessors to be the total taxable value of land and additions on the property. | Land | Improvement |
|---|---|---|---|---|
| 2025 | $3,453 | $342,291 | $62,424 | $279,867 |
| 2023 | $1,945 | $184,697 | $31,295 | $153,402 |
| 2022 | $1,918 | $181,077 | $30,682 | $150,395 |
| 2021 | $1,846 | $177,528 | $30,081 | $147,447 |
| 2020 | $1,866 | $175,709 | $29,773 | $145,936 |
| 2019 | $1,790 | $172,265 | $29,190 | $143,075 |
| 2018 | $1,793 | $168,888 | $28,618 | $140,270 |
| 2017 | $1,781 | $165,577 | $28,057 | $137,520 |
| 2016 | $1,660 | $162,331 | $27,507 | $134,824 |
| 2015 | -- | $159,893 | $27,094 | $132,799 |
| 2014 | $1,621 | $156,762 | $26,564 | $130,198 |
Source: Public Records
Map
Nearby Homes
- 537 Stanmar Dr
- 553 Stanmar Dr
- 542 Hyland Dr
- 554 Hyland Dr
- 538 Hyland Dr
- 565 Stanmar Dr
- 542 Stanmar Dr
- 0 Stanmar Dr Unit TC201040323
- 0 Stanmar Dr Unit 201140698
- 525 Stanmar Dr
- 554 Stanmar Dr
- 538 Stanmar Dr
- 570 Hyland Dr
- 526 Hyland Dr
- 566 Stanmar Dr
- 579 Stanmar Dr
- 541 Hyland Dr
- 588 Hyland Dr
- 537 Hyland Dr
- 578 Stanmar Dr