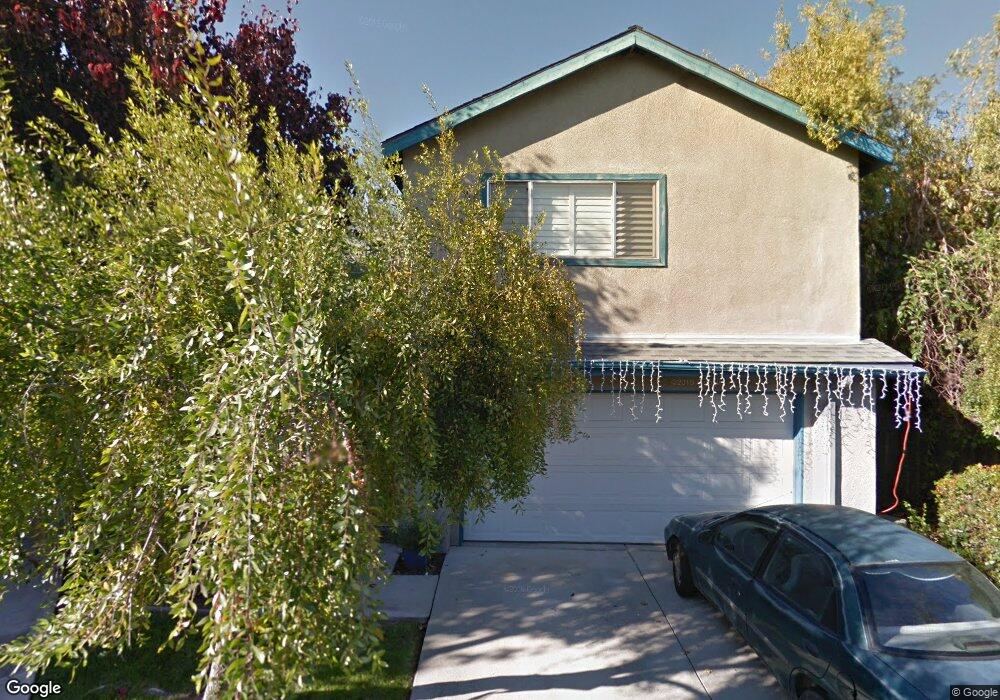
542 Jay Ct Nipomo, CA 93444
Estimated Value: $546,000 - $563,957
3
Beds
3
Baths
1,309
Sq Ft
$423/Sq Ft
Est. Value
About This Home
This home is located at 542 Jay Ct, Nipomo, CA 93444 and is currently estimated at $553,739, approximately $423 per square foot. 542 Jay Ct is a home located in San Luis Obispo County with nearby schools including Dana Elementary School, Mesa Middle School, and Nipomo High School.
Ownership History
Date
Name
Owned For
Owner Type
Purchase Details
Closed on
Dec 8, 1999
Sold by
Va
Bought by
Brown James R and Brown Jackie J
Current Estimated Value
Home Financials for this Owner
Home Financials are based on the most recent Mortgage that was taken out on this home.
Original Mortgage
$147,286
Outstanding Balance
$45,687
Interest Rate
7.96%
Mortgage Type
FHA
Estimated Equity
$508,052
Purchase Details
Closed on
Nov 12, 1999
Sold by
Brown James R and Brown Jackie J
Bought by
Schutt David E and Schutt Cheryl A
Home Financials for this Owner
Home Financials are based on the most recent Mortgage that was taken out on this home.
Original Mortgage
$147,286
Outstanding Balance
$45,687
Interest Rate
7.96%
Mortgage Type
FHA
Estimated Equity
$508,052
Purchase Details
Closed on
Jul 9, 1997
Sold by
Skylark Park Llc
Bought by
Va
Create a Home Valuation Report for This Property
The Home Valuation Report is an in-depth analysis detailing your home's value as well as a comparison with similar homes in the area
Home Values in the Area
Average Home Value in this Area
Purchase History
| Date | Buyer | Sale Price | Title Company |
|---|---|---|---|
| Brown James R | -- | Fidelity National Title Co | |
| Schutt David E | $148,500 | Fidelity National Title Co | |
| Va | $130,000 | First American Title Ins Co |
Source: Public Records
Mortgage History
| Date | Status | Borrower | Loan Amount |
|---|---|---|---|
| Open | Schutt David E | $147,286 |
Source: Public Records
Tax History
| Year | Tax Paid | Tax Assessment Tax Assessment Total Assessment is a certain percentage of the fair market value that is determined by local assessors to be the total taxable value of land and additions on the property. | Land | Improvement |
|---|---|---|---|---|
| 2025 | $2,347 | $228,220 | $76,838 | $151,382 |
| 2024 | $2,321 | $223,746 | $75,332 | $148,414 |
| 2023 | $2,321 | $219,359 | $73,855 | $145,504 |
| 2022 | $2,286 | $215,058 | $72,407 | $142,651 |
| 2021 | $2,281 | $210,842 | $70,988 | $139,854 |
| 2020 | $2,255 | $208,681 | $70,261 | $138,420 |
| 2019 | $2,241 | $204,590 | $68,884 | $135,706 |
| 2018 | $2,215 | $200,580 | $67,534 | $133,046 |
| 2017 | $2,173 | $196,648 | $66,210 | $130,438 |
| 2016 | $2,050 | $192,793 | $64,912 | $127,881 |
| 2015 | $2,020 | $189,898 | $63,937 | $125,961 |
| 2014 | $1,945 | $186,179 | $62,685 | $123,494 |
Source: Public Records
Map
Nearby Homes
- 368 Avenida de Amigos
- 525 Grande Ave Unit D
- 571 S Oakglen Ave
- 567 S Oakglen Ave
- 565 S Oakglen Ave
- 483 Violet Ave
- 424 Bermuda Place
- Mesa Plan at Hill Street Terraces - Hill Street Series
- Pacific Plan at Hill Street Terraces - Hill Street Series
- Monarch Plan at Hill Street Terraces - Hill Street Series
- Rancho Plan at Hill Street Terraces - Hill Street Series
- Dana Plan at Hill Street Terraces - Hill Street Series
- 449 W Tefft St
- 449 W Tefft St Unit 23
- 449 W Tefft St Unit 13
- 680 Hill St
- 522 Higos Way
- 136 Clearwater Ln
- 160 San Antonio Ln
- 719 W Tefft St
Your Personal Tour Guide
Ask me questions while you tour the home.