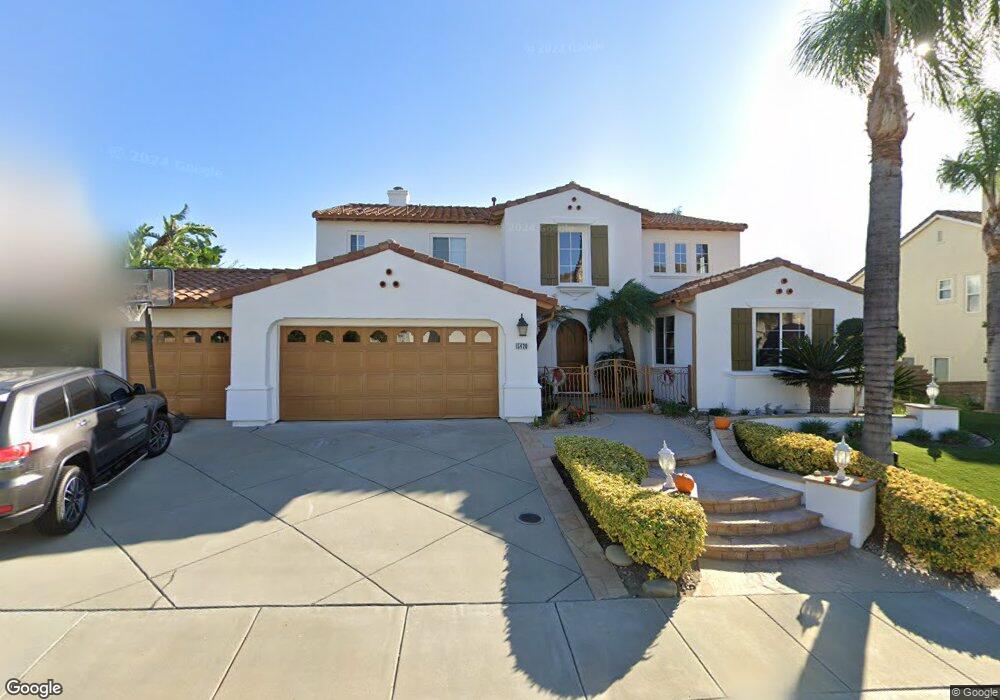
5420 Evening Sky Dr Simi Valley, CA 93063
East Simi Valley NeighborhoodEstimated Value: $1,319,000 - $1,530,000
5
Beds
5
Baths
3,466
Sq Ft
$417/Sq Ft
Est. Value
About This Home
This home is located at 5420 Evening Sky Dr, Simi Valley, CA 93063 and is currently estimated at $1,444,281, approximately $416 per square foot. 5420 Evening Sky Dr is a home located in Ventura County with nearby schools including Big Springs Elementary School, Valley View Middle School, and Simi Valley High School.
Ownership History
Date
Name
Owned For
Owner Type
Purchase Details
Closed on
Jul 12, 2007
Sold by
Ourfalian Samer B and Ourfalian Carolyn A
Bought by
Fisher Michael and Fisher Livia
Current Estimated Value
Home Financials for this Owner
Home Financials are based on the most recent Mortgage that was taken out on this home.
Original Mortgage
$672,000
Outstanding Balance
$418,419
Interest Rate
6.79%
Mortgage Type
Purchase Money Mortgage
Estimated Equity
$1,025,862
Purchase Details
Closed on
Dec 1, 2006
Sold by
Ourfalian Samer B and Ourfalian Carolyn A
Bought by
Ourfalian Samer B and Ourfalian Carolyn A
Purchase Details
Closed on
Apr 20, 1999
Sold by
Centex Homes
Bought by
Ourfalian Samer B and Ourfalian Carolyn A
Home Financials for this Owner
Home Financials are based on the most recent Mortgage that was taken out on this home.
Original Mortgage
$419,850
Interest Rate
7.05%
Create a Home Valuation Report for This Property
The Home Valuation Report is an in-depth analysis detailing your home's value as well as a comparison with similar homes in the area
Home Values in the Area
Average Home Value in this Area
Purchase History
| Date | Buyer | Sale Price | Title Company |
|---|---|---|---|
| Fisher Michael | $960,000 | United Title Company | |
| Ourfalian Samer B | -- | None Available | |
| Ourfalian Samer B | $525,000 | Chicago Title Co |
Source: Public Records
Mortgage History
| Date | Status | Borrower | Loan Amount |
|---|---|---|---|
| Open | Fisher Michael | $672,000 | |
| Previous Owner | Ourfalian Samer B | $419,850 | |
| Closed | Ourfalian Samer B | $52,500 |
Source: Public Records
Tax History
| Year | Tax Paid | Tax Assessment Tax Assessment Total Assessment is a certain percentage of the fair market value that is determined by local assessors to be the total taxable value of land and additions on the property. | Land | Improvement |
|---|---|---|---|---|
| 2025 | $14,358 | $1,260,960 | $819,628 | $441,332 |
| 2024 | $14,358 | $1,236,236 | $803,557 | $432,679 |
| 2023 | $13,510 | $1,211,997 | $787,801 | $424,196 |
| 2022 | $13,524 | $1,188,233 | $772,354 | $415,879 |
| 2021 | $13,486 | $1,164,935 | $757,210 | $407,725 |
| 2020 | $13,248 | $1,152,993 | $749,447 | $403,546 |
| 2019 | $12,656 | $1,130,386 | $734,752 | $395,634 |
| 2018 | $12,591 | $1,108,223 | $720,346 | $387,877 |
| 2017 | $12,342 | $1,086,494 | $706,222 | $380,272 |
| 2016 | $11,804 | $1,065,191 | $692,375 | $372,816 |
| 2015 | $11,589 | $1,049,193 | $681,976 | $367,217 |
| 2014 | $9,920 | $886,000 | $576,000 | $310,000 |
Source: Public Records
Map
Nearby Homes
- 5474 Sunlight St
- 3286 Indian Creek Place
- 28 Chivo
- 62 Las Lljas Canyon Rd
- 125 Fern Dr
- 25 Chivo
- 26 Chivo
- 27 Chivo
- 5635 Evening Sky Dr
- 5817 Evening Sky Dr
- 5831 Evening Sky Dr
- 5853 Spirit Lake Ct
- 5019 Corral St
- 4679 Summit Ave
- 4683 Summit Ave
- 5068 Shady Trail St
- 2772 Annandale Ln
- 4920 Corral St
- 6051 Mescallero Place
- 3125 Calusa Ave
- 5434 Evening Sky Dr
- 5406 Evening Sky Dr
- 5429 Sunlight St
- 5435 Sunlight St
- 5417 Sunlight St
- 5448 Evening Sky Dr
- 5390 Evening Sky Dr
- 5447 Sunlight St
- 5407 Evening Sky Dr
- 5425 Evening Sky Dr
- 5405 Sunlight St
- 5462 Evening Sky Dr
- 5459 Sunlight St
- 5391 Evening Sky Dr
- 5364 Evening Sky Dr
- 5443 Evening Sky Dr
- 5422 Sunlight St
- 5434 Sunlight St
- 5446 Sunlight St
- 5476 Evening Sky Dr
Your Personal Tour Guide
Ask me questions while you tour the home.