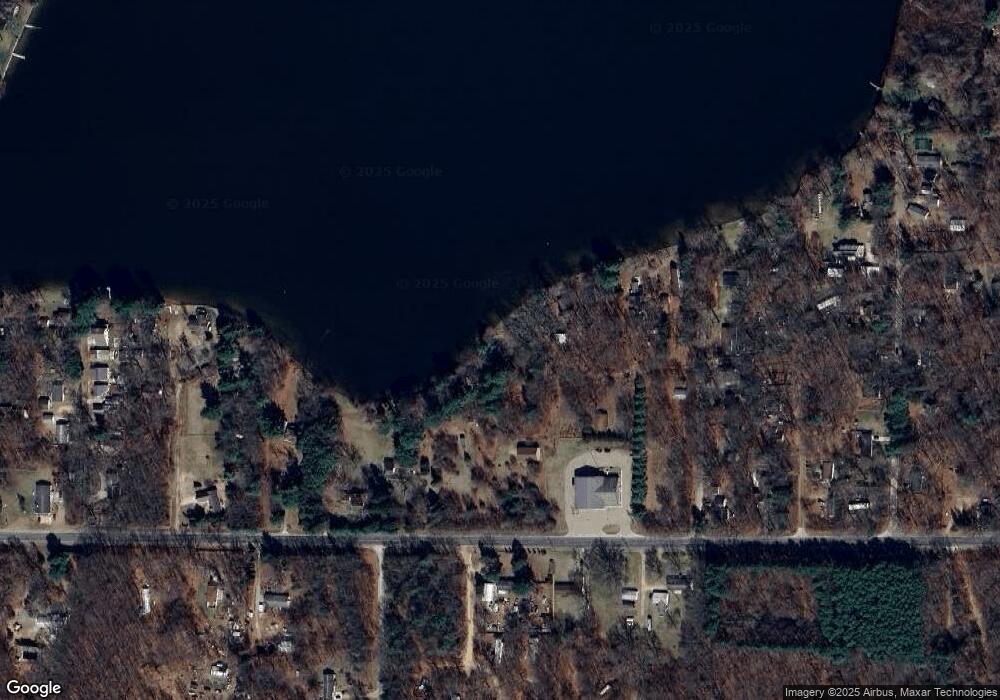
5428 Lake St Pullman, MI 49450
Estimated Value: $140,000 - $360,000
2
Beds
1
Bath
608
Sq Ft
$392/Sq Ft
Est. Value
About This Home
This home is located at 5428 Lake St, Pullman, MI 49450 and is currently estimated at $238,580, approximately $392 per square foot. 5428 Lake St is a home with nearby schools including Bloomingdale High School.
Ownership History
Date
Name
Owned For
Owner Type
Purchase Details
Closed on
Feb 6, 2024
Sold by
Surina Michael R
Bought by
Julie Surina Trust and Surina
Current Estimated Value
Purchase Details
Closed on
May 22, 2009
Sold by
Kostelyk James
Bought by
Surina Michael R
Home Financials for this Owner
Home Financials are based on the most recent Mortgage that was taken out on this home.
Original Mortgage
$80,000
Interest Rate
4.84%
Mortgage Type
Unknown
Create a Home Valuation Report for This Property
The Home Valuation Report is an in-depth analysis detailing your home's value as well as a comparison with similar homes in the area
Purchase History
| Date | Buyer | Sale Price | Title Company |
|---|---|---|---|
| Julie Surina Trust | -- | None Listed On Document | |
| Surina Michael R | $100,000 | Chicago Title |
Source: Public Records
Mortgage History
| Date | Status | Borrower | Loan Amount |
|---|---|---|---|
| Previous Owner | Surina Michael R | $80,000 |
Source: Public Records
Tax History
| Year | Tax Paid | Tax Assessment Tax Assessment Total Assessment is a certain percentage of the fair market value that is determined by local assessors to be the total taxable value of land and additions on the property. | Land | Improvement |
|---|---|---|---|---|
| 2025 | $2,087 | $97,000 | $68,600 | $28,400 |
| 2024 | $1,087 | $70,200 | $41,600 | $28,600 |
| 2023 | $1,087 | $57,700 | $28,200 | $29,500 |
| 2022 | $1,087 | $51,300 | $25,600 | $25,700 |
| 2020 | $1,381 | $39,100 | $20,800 | $18,300 |
| 2019 | $1,338 | $39,000 | $20,800 | $18,200 |
| 2018 | $0 | $37,400 | $20,800 | $16,600 |
| 2017 | $0 | $39,100 | $20,800 | $18,300 |
| 2016 | $0 | $32,800 | $18,400 | $14,400 |
| 2015 | -- | $32,800 | $18,400 | $14,400 |
| 2014 | -- | $23,900 | $14,100 | $9,800 |
| 2013 | -- | $26,000 | $16,000 | $10,000 |
Source: Public Records
Map
Nearby Homes
Your Personal Tour Guide
Ask me questions while you tour the home.