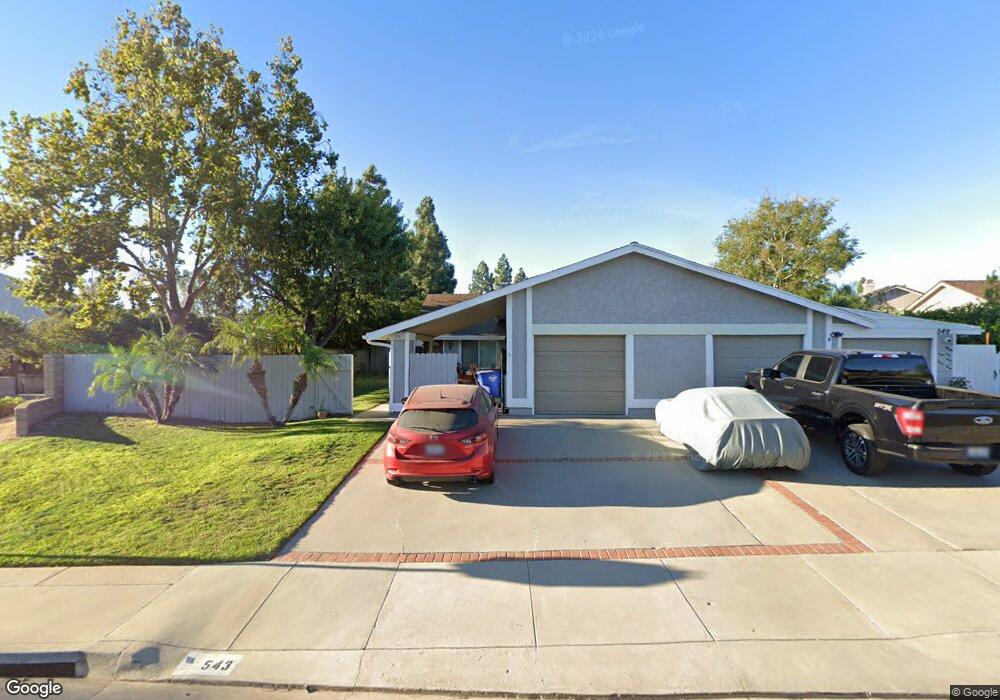
543 Hillcrest Dr Camarillo, CA 93012
Estimated Value: $547,000 - $784,000
2
Beds
2
Baths
919
Sq Ft
$735/Sq Ft
Est. Value
About This Home
This home is located at 543 Hillcrest Dr, Camarillo, CA 93012 and is currently estimated at $675,116, approximately $734 per square foot. 543 Hillcrest Dr is a home located in Ventura County with nearby schools including La Mariposa Elementary School, Las Colinas Middle School, and Adolfo Camarillo High School.
Ownership History
Date
Name
Owned For
Owner Type
Purchase Details
Closed on
May 10, 2024
Sold by
Beaumont Kathryn S
Bought by
Kathryn S Beaumont Trust and Beaumont
Current Estimated Value
Purchase Details
Closed on
Oct 8, 2001
Sold by
Reverse Exchange Corp Inc
Bought by
Beaumont Kathryn S
Home Financials for this Owner
Home Financials are based on the most recent Mortgage that was taken out on this home.
Original Mortgage
$212,642
Interest Rate
6.91%
Mortgage Type
FHA
Purchase Details
Closed on
Aug 30, 2001
Sold by
Davis Joyce D
Bought by
Reverse Exchange Corp Inc
Home Financials for this Owner
Home Financials are based on the most recent Mortgage that was taken out on this home.
Original Mortgage
$212,642
Interest Rate
6.91%
Mortgage Type
FHA
Purchase Details
Closed on
Aug 16, 2001
Sold by
Davis Joyce D
Bought by
Beaumont Kathy
Home Financials for this Owner
Home Financials are based on the most recent Mortgage that was taken out on this home.
Original Mortgage
$212,642
Interest Rate
6.91%
Mortgage Type
FHA
Create a Home Valuation Report for This Property
The Home Valuation Report is an in-depth analysis detailing your home's value as well as a comparison with similar homes in the area
Home Values in the Area
Average Home Value in this Area
Purchase History
| Date | Buyer | Sale Price | Title Company |
|---|---|---|---|
| Kathryn S Beaumont Trust | -- | None Listed On Document | |
| Beaumont Kathryn S | -- | Fidelity National Title Co | |
| Reverse Exchange Corp Inc | $228,000 | Fidelity National Title Co | |
| Beaumont Kathy | $216,000 | Fidelity National Title Co |
Source: Public Records
Mortgage History
| Date | Status | Borrower | Loan Amount |
|---|---|---|---|
| Previous Owner | Beaumont Kathy | $212,642 |
Source: Public Records
Tax History
| Year | Tax Paid | Tax Assessment Tax Assessment Total Assessment is a certain percentage of the fair market value that is determined by local assessors to be the total taxable value of land and additions on the property. | Land | Improvement |
|---|---|---|---|---|
| 2025 | $3,506 | $323,989 | $127,627 | $196,362 |
| 2024 | $3,506 | $317,637 | $125,125 | $192,512 |
| 2023 | $3,379 | $311,409 | $122,671 | $188,738 |
| 2022 | $3,368 | $305,303 | $120,265 | $185,038 |
| 2021 | $3,246 | $299,317 | $117,907 | $181,410 |
| 2020 | $3,233 | $296,249 | $116,699 | $179,550 |
| 2019 | $3,217 | $290,441 | $114,411 | $176,030 |
| 2018 | $3,157 | $284,747 | $112,168 | $172,579 |
| 2017 | $2,973 | $279,165 | $109,969 | $169,196 |
| 2016 | $2,900 | $273,692 | $107,813 | $165,879 |
| 2015 | $2,869 | $269,584 | $106,195 | $163,389 |
| 2014 | $2,801 | $264,306 | $104,116 | $160,190 |
Source: Public Records
Map
Nearby Homes
- 499 Sobre Colinas Place
- 4696 Refugio Ct
- 27 Tahquitz Dr Unit 226
- 18 Tahquitz Ct Unit 217
- 395 Via Cantilena
- 14 Tahquitz Ct Unit 213
- 59 Caleta Dr Unit 177
- 50 Tahquitz Ct Unit 249
- 353 Via Cantilena Unit 87
- 8 Calle Fronte Unit 204
- 472 Via Olivera
- 231 Calle Orovista
- 207 Caleta Dr Unit 98
- 182 Rancho Adolfo Dr Unit 83
- 74 Caleta Dr Unit 162
- 222 Calle Fronte Unit 29
- 161 Tahquitz Dr Unit 35
- 5200 Prairieview St
- 449 Pecana St
- 5211 Village 5
- 549 Hillcrest Dr
- 553 Hillcrest Dr
- 412 Aliento Way
- 572 Hacienda Dr
- 424 Aliento Way
- 557 Hillcrest Dr
- 478 Hillcrest Dr
- 485 Sobre Colinas Place
- 582 Hacienda Dr
- 561 Hillcrest Dr
- 477 Sobre Colinas Place
- 469 Sobre Colinas Place
- 594 Hacienda Dr
- 4904 Ladera Vista Dr
- 468 Aliento Way
- 567 Hillcrest Dr
- 574 Hillcrest Dr
- 604 Hacienda Dr
- 4916 Ladera Vista Dr
- 573 Hillcrest Dr
Your Personal Tour Guide
Ask me questions while you tour the home.