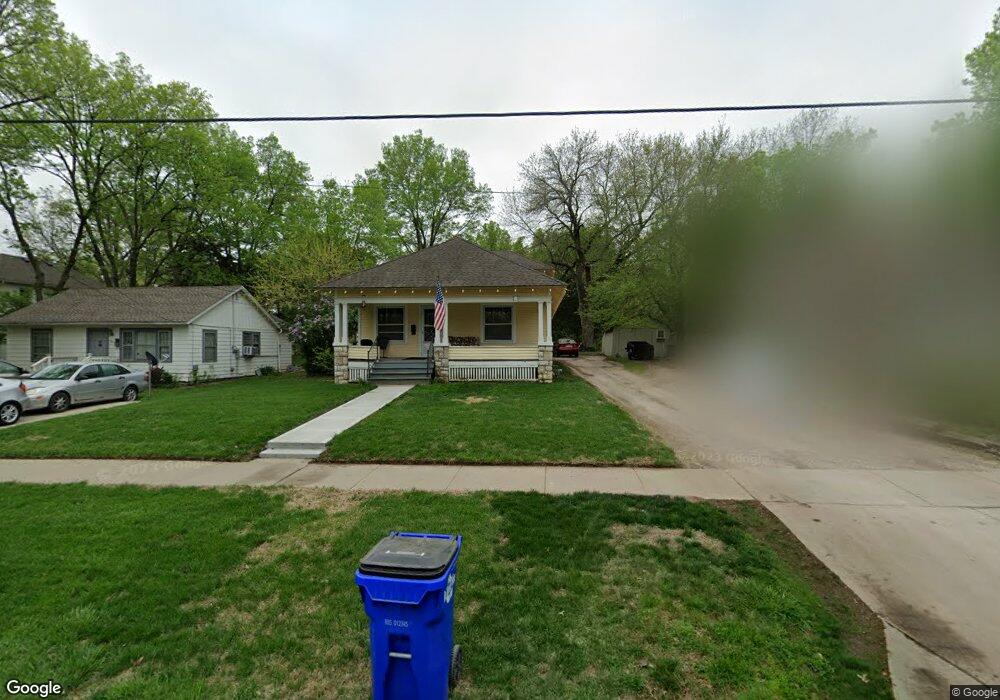
543 W Cedar St Olathe, KS 66061
Estimated Value: $257,000 - $285,000
3
Beds
2
Baths
1,623
Sq Ft
$168/Sq Ft
Est. Value
About This Home
This home is located at 543 W Cedar St, Olathe, KS 66061 and is currently estimated at $273,367, approximately $168 per square foot. 543 W Cedar St is a home located in Johnson County with nearby schools including Westview Elementary School, Oregon Trail Middle School, and Olathe West High School.
Ownership History
Date
Name
Owned For
Owner Type
Purchase Details
Closed on
Dec 20, 2023
Sold by
Lang Anthony Justin and Lang Tyson John
Bought by
Lang Family Trust
Current Estimated Value
Purchase Details
Closed on
Dec 15, 2011
Sold by
Staudinger Gerald
Bought by
Lang Anthony Justin and Lang Tyson John
Home Financials for this Owner
Home Financials are based on the most recent Mortgage that was taken out on this home.
Original Mortgage
$35,000
Interest Rate
8%
Mortgage Type
Purchase Money Mortgage
Create a Home Valuation Report for This Property
The Home Valuation Report is an in-depth analysis detailing your home's value as well as a comparison with similar homes in the area
Home Values in the Area
Average Home Value in this Area
Purchase History
| Date | Buyer | Sale Price | Title Company |
|---|---|---|---|
| Lang Family Trust | -- | None Listed On Document | |
| Lang Anthony Justin | -- | Alpha Title Llc |
Source: Public Records
Mortgage History
| Date | Status | Borrower | Loan Amount |
|---|---|---|---|
| Previous Owner | Lang Anthony Justin | $35,000 |
Source: Public Records
Tax History
| Year | Tax Paid | Tax Assessment Tax Assessment Total Assessment is a certain percentage of the fair market value that is determined by local assessors to be the total taxable value of land and additions on the property. | Land | Improvement |
|---|---|---|---|---|
| 2025 | $2,350 | $24,714 | $4,806 | $19,908 |
| 2023 | $2,221 | $19,803 | $4,806 | $14,997 |
| 2022 | $2,154 | $18,665 | $4,368 | $14,297 |
| 2021 | $2,167 | $17,699 | $3,968 | $13,731 |
| 2020 | $2,095 | $16,974 | $3,605 | $13,369 |
| 2019 | $1,922 | $15,491 | $3,135 | $12,356 |
| 2018 | $1,792 | $14,364 | $2,849 | $11,515 |
| 2017 | $1,490 | $11,880 | $2,849 | $9,031 |
| 2016 | $1,366 | $11,190 | $2,849 | $8,341 |
| 2015 | $1,277 | $10,488 | $2,849 | $7,639 |
| 2013 | -- | $9,384 | $2,589 | $6,795 |
Source: Public Records
Map
Nearby Homes
- 600 W Elm St
- 573 W Loula St
- 316 W Elm St
- 601 S Troost St
- 629 S Sherman Ave
- 513 S Water St
- 401 S Harrison St
- 728 S Kansas Ave
- 612 N Logan St
- 313 S Walker St
- 811 S Cherry St
- 430 E Loula St
- 1529 W Park St
- 1528 W Romany Ct
- 511 E Sheridan St
- 616 S Montclaire Dr
- 525 N Stevenson St
- 513 N Walker Ln
- 4408 S Lane St
- 1051 W Ashbury St
Your Personal Tour Guide
Ask me questions while you tour the home.