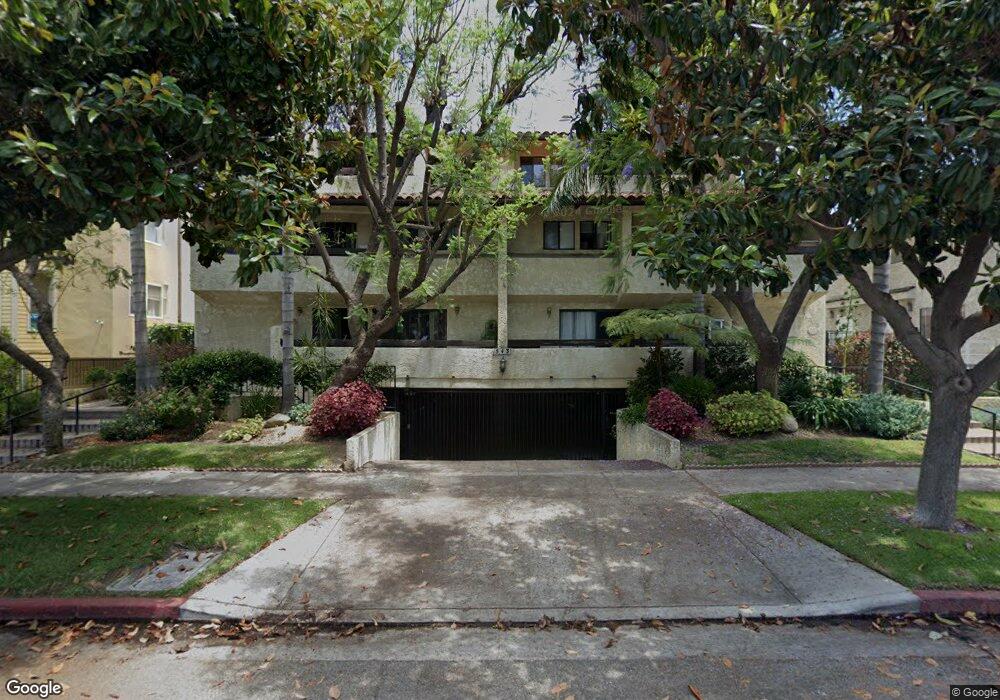
543 W Stocker St Unit 1 Glendale, CA 91202
Glenwood NeighborhoodEstimated Value: $676,000 - $754,000
2
Beds
3
Baths
1,240
Sq Ft
$575/Sq Ft
Est. Value
About This Home
This home is located at 543 W Stocker St Unit 1, Glendale, CA 91202 and is currently estimated at $713,572, approximately $575 per square foot. 543 W Stocker St Unit 1 is a home located in Los Angeles County with nearby schools including Balboa Elementary School, Eleanor J. Toll Middle School, and Herbert Hoover High School.
Ownership History
Date
Name
Owned For
Owner Type
Purchase Details
Closed on
Feb 3, 2022
Sold by
Lake Myers Jordan and Lake Tiffany D
Bought by
Tareic Buys Houses Llc
Current Estimated Value
Purchase Details
Closed on
Jul 29, 2011
Sold by
U S Bank National Association
Bought by
Khojayan Shaun
Home Financials for this Owner
Home Financials are based on the most recent Mortgage that was taken out on this home.
Original Mortgage
$193,875
Interest Rate
4.53%
Mortgage Type
New Conventional
Purchase Details
Closed on
Mar 14, 2011
Sold by
Torres Andres A
Bought by
U S Bank National Association
Purchase Details
Closed on
Aug 20, 2007
Sold by
Torres Andres A
Bought by
The Andres Torres Living Trust
Create a Home Valuation Report for This Property
The Home Valuation Report is an in-depth analysis detailing your home's value as well as a comparison with similar homes in the area
Home Values in the Area
Average Home Value in this Area
Purchase History
| Date | Buyer | Sale Price | Title Company |
|---|---|---|---|
| Tareic Buys Houses Llc | $570,000 | Chicago Title | |
| Khojayan Shaun | $258,500 | Landsafe Title Of Ca Inc | |
| U S Bank National Association | $234,900 | Accommodation | |
| The Andres Torres Living Trust | -- | None Available |
Source: Public Records
Mortgage History
| Date | Status | Borrower | Loan Amount |
|---|---|---|---|
| Previous Owner | Khojayan Shaun | $193,875 |
Source: Public Records
Tax History Compared to Growth
Tax History
| Year | Tax Paid | Tax Assessment Tax Assessment Total Assessment is a certain percentage of the fair market value that is determined by local assessors to be the total taxable value of land and additions on the property. | Land | Improvement |
|---|---|---|---|---|
| 2025 | $3,597 | $324,678 | $142,808 | $181,870 |
| 2024 | $3,597 | $318,312 | $140,008 | $178,304 |
| 2023 | $3,517 | $312,071 | $137,263 | $174,808 |
| 2022 | $3,453 | $305,953 | $134,572 | $171,381 |
| 2021 | $3,390 | $299,955 | $131,934 | $168,021 |
| 2019 | $3,260 | $291,061 | $128,022 | $163,039 |
| 2018 | $3,209 | $285,355 | $125,512 | $159,843 |
| 2016 | $3,054 | $274,276 | $120,639 | $153,637 |
| 2015 | $2,992 | $270,157 | $118,827 | $151,330 |
| 2014 | $2,970 | $264,866 | $116,500 | $148,366 |
Source: Public Records
Map
Nearby Homes
- 537 W Stocker St Unit 5
- 570 W Stocker St Unit 201
- 0 N Idlewood Rd
- 600 W Stocker St Unit 312
- 588 South St
- 1203 N Kenilworth Ave
- 1156 Concord St
- 545 Spencer St
- 451 Palm Dr
- 1207 N Columbus Ave
- 1325 Valley View Rd Unit 307
- 1436 N Columbus Ave
- 430 W Kenneth Rd
- 248 W Loraine St Unit 107
- 1406 1/2 Valley View Rd
- 1339 Highland Ave
- 409 Burchett St Unit 315
- 409 Burchett St Unit 220
- 811 N Columbus Ave Unit 18
- 332 Cumberland Rd
- 543 W Stocker St Unit 11
- 543 W Stocker St Unit 14
- 543 W Stocker St Unit 13
- 543 W Stocker St Unit 12
- 543 W Stocker St Unit 10
- 543 W Stocker St Unit 9
- 543 W Stocker St Unit 8
- 543 W Stocker St Unit 7
- 543 W Stocker St Unit 6
- 543 W Stocker St Unit 5
- 543 W Stocker St Unit 3
- 543 W Stocker St Unit 2
- 551 W Stocker St Unit 9
- 551 W Stocker St Unit 8
- 551 W Stocker St Unit 7
- 551 W Stocker St Unit 6
- 551 W Stocker St Unit 4
- 551 W Stocker St Unit 2
- 551 W Stocker St Unit 1
- 551 W Stocker St Unit 10