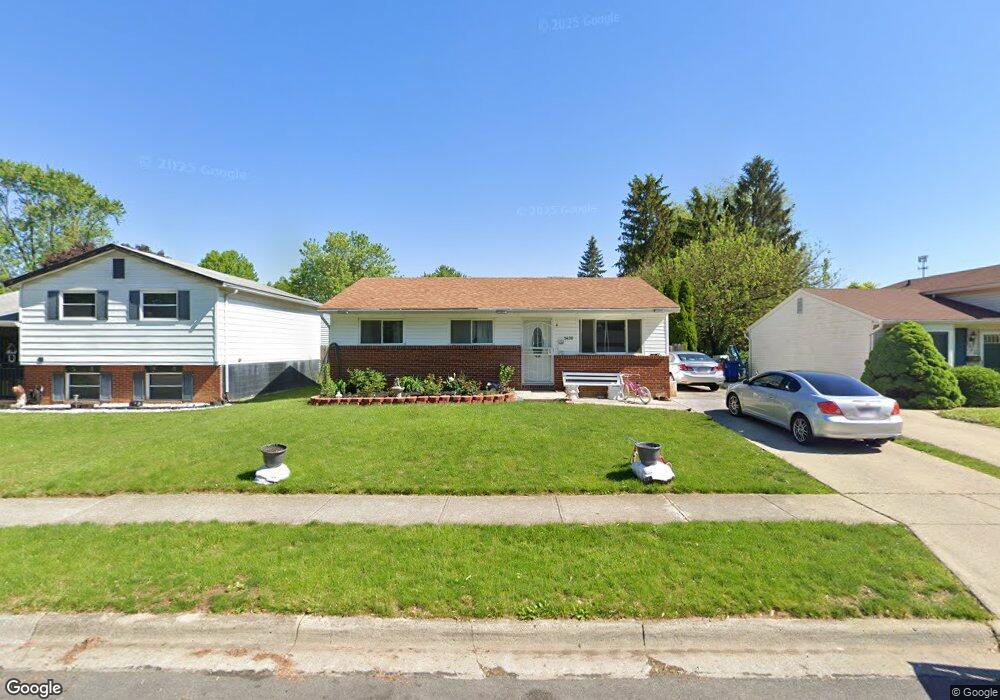
5430 Monfort Ave Columbus, OH 43232
Walnut Heights NeighborhoodEstimated Value: $175,211 - $207,000
2
Beds
1
Bath
945
Sq Ft
$202/Sq Ft
Est. Value
About This Home
This home is located at 5430 Monfort Ave, Columbus, OH 43232 and is currently estimated at $191,303, approximately $202 per square foot. 5430 Monfort Ave is a home located in Franklin County with nearby schools including Liberty Elementary School, Yorktown Middle School, and Independence High School.
Ownership History
Date
Name
Owned For
Owner Type
Purchase Details
Closed on
Dec 13, 2010
Sold by
Secretary Of Housing & Urban Development
Bought by
Castaneda Julio
Current Estimated Value
Purchase Details
Closed on
Dec 1, 2009
Sold by
Bricker John J and Case #08Cve 09 13977
Bought by
Us Bank Na
Purchase Details
Closed on
Aug 12, 2009
Sold by
Us Bank Na
Bought by
Secretary Of Housing & Urban Development
Purchase Details
Closed on
May 11, 2001
Sold by
Schirack Properties Llc
Bought by
Bricker John J
Home Financials for this Owner
Home Financials are based on the most recent Mortgage that was taken out on this home.
Original Mortgage
$71,405
Interest Rate
7.18%
Mortgage Type
FHA
Purchase Details
Closed on
Apr 4, 2001
Sold by
Barnhouse Terry L and Associates Home Equity Service
Bought by
Schirack Properties Llc
Home Financials for this Owner
Home Financials are based on the most recent Mortgage that was taken out on this home.
Original Mortgage
$71,405
Interest Rate
7.18%
Mortgage Type
FHA
Purchase Details
Closed on
Dec 17, 1984
Bought by
Alley Susan E
Create a Home Valuation Report for This Property
The Home Valuation Report is an in-depth analysis detailing your home's value as well as a comparison with similar homes in the area
Home Values in the Area
Average Home Value in this Area
Purchase History
| Date | Buyer | Sale Price | Title Company |
|---|---|---|---|
| Castaneda Julio | $29,010 | Lakeside Ti | |
| Us Bank Na | $54,000 | None Available | |
| Secretary Of Housing & Urban Development | -- | None Available | |
| Bricker John J | $72,000 | Lawyers Title | |
| Schirack Properties Llc | $52,200 | -- | |
| Alley Susan E | -- | -- |
Source: Public Records
Mortgage History
| Date | Status | Borrower | Loan Amount |
|---|---|---|---|
| Previous Owner | Bricker John J | $71,405 |
Source: Public Records
Tax History Compared to Growth
Tax History
| Year | Tax Paid | Tax Assessment Tax Assessment Total Assessment is a certain percentage of the fair market value that is determined by local assessors to be the total taxable value of land and additions on the property. | Land | Improvement |
|---|---|---|---|---|
| 2024 | $2,397 | $53,420 | $16,980 | $36,440 |
| 2023 | $2,367 | $53,410 | $16,975 | $36,435 |
| 2022 | $1,358 | $26,180 | $5,250 | $20,930 |
| 2021 | $1,360 | $26,180 | $5,250 | $20,930 |
| 2020 | $1,362 | $26,180 | $5,250 | $20,930 |
| 2019 | $1,321 | $21,780 | $4,380 | $17,400 |
| 2018 | $1,246 | $21,780 | $4,380 | $17,400 |
| 2017 | $1,306 | $21,780 | $4,380 | $17,400 |
| 2016 | $1,292 | $19,500 | $3,640 | $15,860 |
| 2015 | $1,173 | $19,500 | $3,640 | $15,860 |
| 2014 | $1,175 | $19,500 | $3,640 | $15,860 |
| 2013 | $643 | $21,630 | $4,025 | $17,605 |
Source: Public Records
Map
Nearby Homes
- 2730 Raphael Dr
- 5278 Glenbriar Ct
- 2744 Barrows Rd
- 2736 Barrows Rd
- 2651 Brownfield Rd
- 5377 Bleaker Ave
- 2705 Denmark Rd
- 5268 Carbondale Dr
- 2991 Blue Moon Dr
- 5401 Spire Ln
- 5373 Spire Ln
- 2998 Osgood Rd E
- 3148 Aldgate St
- 5011 Refugee Rd
- 5114 Carbondale Dr
- 3198 Gallant Dr
- 2447 Maybury Rd
- 5061 Labelle Dr
- 5123 Jameson Dr
- 5144 Botsford Dr
- 5424 Monfort Ave
- 5438 Monfort Ave
- 5433 Mellowbrook Ct
- 2746 Mellowbrook St
- 2738 Mellowbrook St
- 2743 Raphael Dr
- 2737 Raphael Dr
- 5429 Monfort Ave
- 5441 Mellowbrook Ct
- 2730 Mellowbrook St
- 2731 Raphael Dr
- 2724 Mellowbrook St
- 2725 Raphael Dr
- 2759 Raphael Dr
- 2772 Millvale St
- 2761 Mellowbrook St
- 2718 Mellowbrook St
- 2719 Raphael Dr
- 2765 Raphael Dr
- 2780 Millvale St