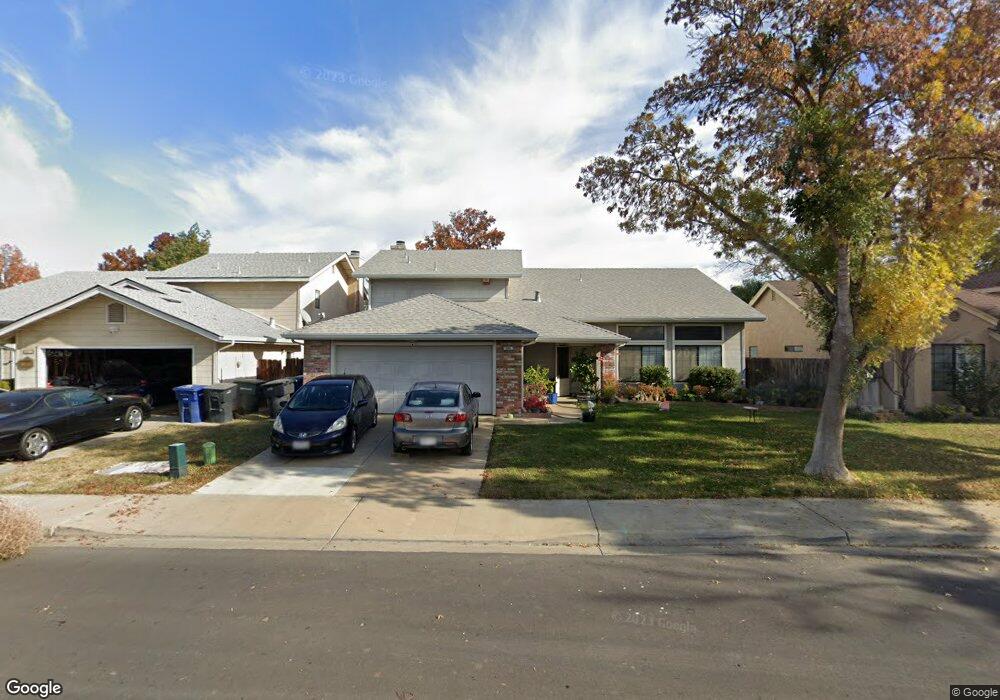
544 S 9th St Patterson, CA 95363
Estimated Value: $490,000 - $506,832
4
Beds
3
Baths
2,245
Sq Ft
$222/Sq Ft
Est. Value
About This Home
This home is located at 544 S 9th St, Patterson, CA 95363 and is currently estimated at $499,458, approximately $222 per square foot. 544 S 9th St is a home located in Stanislaus County with nearby schools including Las Palmas Elementary School, Creekside Middle School, and Patterson High School.
Ownership History
Date
Name
Owned For
Owner Type
Purchase Details
Closed on
Dec 13, 2021
Sold by
Doo Kowng Yiu Tak and Doo Yuk Han
Bought by
Doo David
Current Estimated Value
Purchase Details
Closed on
Aug 5, 2015
Sold by
Han Doo Kowng Yiu Tak and Han Doo Yuk
Bought by
Doo Family Revocable Trust
Home Financials for this Owner
Home Financials are based on the most recent Mortgage that was taken out on this home.
Original Mortgage
$195,000
Interest Rate
3.97%
Mortgage Type
New Conventional
Purchase Details
Closed on
Feb 2, 2015
Sold by
Han Doo Peter and Han Doo Yuk
Bought by
Han Doo Kowng Yiu Tak and Han Doo Yuk
Purchase Details
Closed on
Jul 14, 1993
Sold by
Nelson Steven P and Nelson Diane M
Bought by
Han Doo Pete and Han Doo Yuk
Home Financials for this Owner
Home Financials are based on the most recent Mortgage that was taken out on this home.
Original Mortgage
$109,750
Interest Rate
6.91%
Create a Home Valuation Report for This Property
The Home Valuation Report is an in-depth analysis detailing your home's value as well as a comparison with similar homes in the area
Home Values in the Area
Average Home Value in this Area
Purchase History
| Date | Buyer | Sale Price | Title Company |
|---|---|---|---|
| Doo David | $455,000 | Chicago Title Company | |
| Doo Family Revocable Trust | -- | Accommodation | |
| Han Doo Kowng Yiu Tak | -- | Wfg National Title | |
| Han Doo Kowng Yiu Tak | -- | Wfg National Title | |
| Han Doo Kowng Yiu Tak | -- | None Available | |
| Han Doo Pete | $146,500 | Old Republic |
Source: Public Records
Mortgage History
| Date | Status | Borrower | Loan Amount |
|---|---|---|---|
| Previous Owner | Han Doo Kowng Yiu Tak | $195,000 | |
| Previous Owner | Han Doo Pete | $109,750 |
Source: Public Records
Tax History
| Year | Tax Paid | Tax Assessment Tax Assessment Total Assessment is a certain percentage of the fair market value that is determined by local assessors to be the total taxable value of land and additions on the property. | Land | Improvement |
|---|---|---|---|---|
| 2025 | $6,091 | $519,991 | $175,099 | $344,892 |
| 2024 | $6,073 | $509,796 | $171,666 | $338,130 |
| 2023 | $5,933 | $499,800 | $168,300 | $331,500 |
| 2022 | $5,600 | $490,000 | $165,000 | $325,000 |
| 2021 | $2,898 | $245,546 | $54,951 | $190,595 |
| 2020 | $2,882 | $243,029 | $54,388 | $188,641 |
| 2019 | $2,839 | $238,265 | $53,322 | $184,943 |
| 2018 | $2,705 | $233,594 | $52,277 | $181,317 |
| 2017 | $2,650 | $229,014 | $51,252 | $177,762 |
| 2016 | $2,580 | $224,525 | $50,248 | $174,277 |
| 2015 | $2,545 | $221,154 | $49,494 | $171,660 |
| 2014 | -- | $216,823 | $48,525 | $168,298 |
Source: Public Records
Map
Nearby Homes
- 708 Bonneau Ct
- 15707 S 9th St
- 855 Toyon Ln
- 850 Miraggio Dr
- 1008 Summer Ln
- 191 Fall Ave
- 1117 Van Gogh Ln
- 357 Wolfpack Ct
- 1127 Kestrel Dr
- 1132 Marsh Wren Ct
- 1242 Yellowhammer Dr
- 409 Osprey Dr
- 403 Elfers Rd
- 425 Elfers Rd
- 433 Sanderling Dr
- 647 Ward Ave
- 642 Wanzia Ct
- 192 Torvend Way
- 1314 Sutter Creek Ct
- 432 Meadow Creek Dr
Your Personal Tour Guide
Ask me questions while you tour the home.