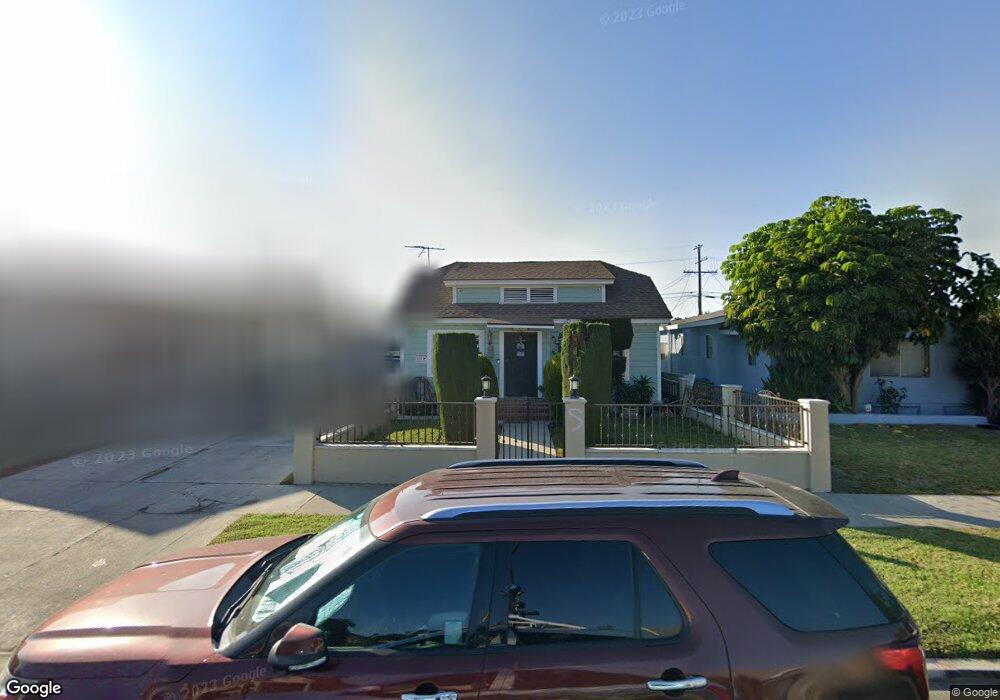
5443 5th Ave Los Angeles, CA 90043
Hyde Park NeighborhoodEstimated Value: $659,179 - $735,000
2
Beds
1
Bath
1,224
Sq Ft
$567/Sq Ft
Est. Value
About This Home
This home is located at 5443 5th Ave, Los Angeles, CA 90043 and is currently estimated at $694,045, approximately $567 per square foot. 5443 5th Ave is a home located in Los Angeles County with nearby schools including Angeles Mesa Elementary School, Audubon Middle School, and Crenshaw Science, Technology, Engineering, Math And Medicine Magnet.
Ownership History
Date
Name
Owned For
Owner Type
Purchase Details
Closed on
May 14, 2020
Sold by
Villeda Edgar G and Villeda Deysy
Bought by
Villeda Edgar G and Villeda Deysy A
Current Estimated Value
Purchase Details
Closed on
Jul 17, 1995
Sold by
Delgado Cleotilde Cruz
Bought by
Villeda Edgar G
Purchase Details
Closed on
May 19, 1994
Sold by
Delgado Cleotilde Cruz
Bought by
Delgado Cleotilde Cruz
Purchase Details
Closed on
Feb 4, 1994
Sold by
Garcia Angel Cruz
Bought by
Cruz Cleotilde
Create a Home Valuation Report for This Property
The Home Valuation Report is an in-depth analysis detailing your home's value as well as a comparison with similar homes in the area
Home Values in the Area
Average Home Value in this Area
Purchase History
| Date | Buyer | Sale Price | Title Company |
|---|---|---|---|
| Villeda Edgar G | -- | None Available | |
| Villeda Edgar G | -- | Southland Title | |
| Delgado Cleotilde Cruz | -- | -- | |
| Cruz Cleotilde | -- | -- |
Source: Public Records
Tax History
| Year | Tax Paid | Tax Assessment Tax Assessment Total Assessment is a certain percentage of the fair market value that is determined by local assessors to be the total taxable value of land and additions on the property. | Land | Improvement |
|---|---|---|---|---|
| 2025 | $2,643 | $202,643 | $149,501 | $53,142 |
| 2024 | $2,596 | $198,670 | $146,570 | $52,100 |
| 2023 | $2,552 | $194,776 | $143,697 | $51,079 |
| 2022 | $2,443 | $190,958 | $140,880 | $50,078 |
| 2021 | $2,405 | $187,215 | $138,118 | $49,097 |
| 2020 | $2,425 | $185,296 | $136,702 | $48,594 |
| 2019 | $2,336 | $181,664 | $134,022 | $47,642 |
| 2018 | $2,236 | $178,103 | $131,395 | $46,708 |
| 2016 | $2,128 | $171,190 | $126,294 | $44,896 |
| 2015 | $2,098 | $168,619 | $124,397 | $44,222 |
| 2014 | $2,114 | $165,317 | $121,961 | $43,356 |
Source: Public Records
Map
Nearby Homes
Your Personal Tour Guide
Ask me questions while you tour the home.