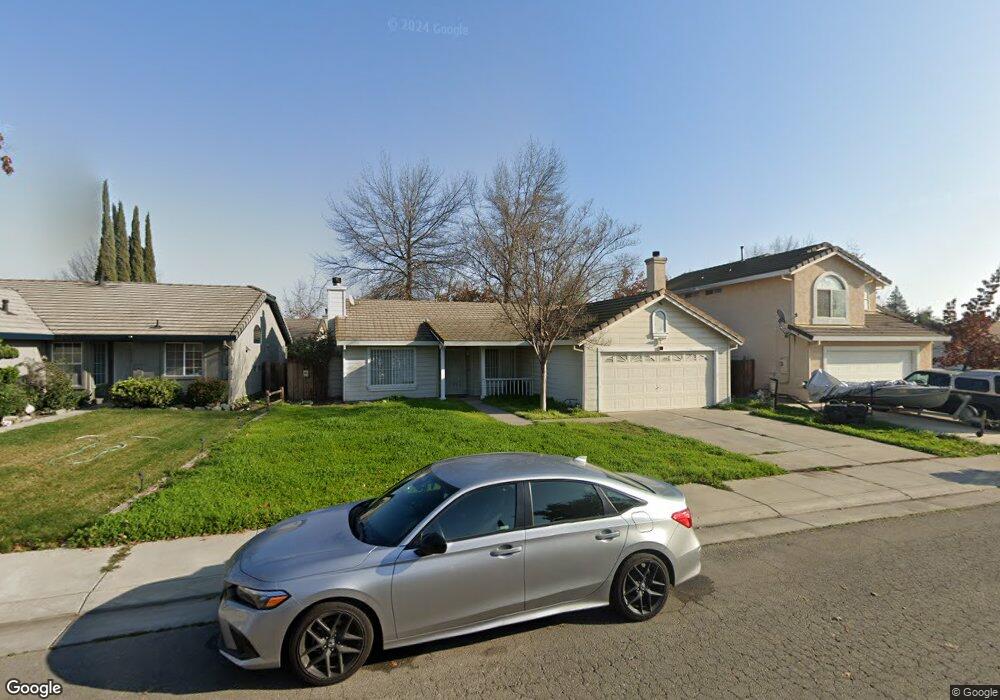
5448 Governor Cir Stockton, CA 95210
Valley Oak NeighborhoodEstimated Value: $361,000 - $447,000
3
Beds
2
Baths
1,357
Sq Ft
$305/Sq Ft
Est. Value
About This Home
This home is located at 5448 Governor Cir, Stockton, CA 95210 and is currently estimated at $413,431, approximately $304 per square foot. 5448 Governor Cir is a home located in San Joaquin County with nearby schools including Rio Calaveras Elementary School, George W. Bush Elementary School, and Valentine Peyton Elementary School.
Ownership History
Date
Name
Owned For
Owner Type
Purchase Details
Closed on
Jul 27, 2013
Sold by
Galicia Kimberly
Bought by
Galicia Rick
Current Estimated Value
Purchase Details
Closed on
Jan 17, 2012
Sold by
Galicia Rick
Bought by
Galicia Kimberly
Purchase Details
Closed on
Jun 18, 2001
Sold by
Atreaga Robert and Atreaga Arvie M
Bought by
Galicia Rick and Galicia Kimberly
Home Financials for this Owner
Home Financials are based on the most recent Mortgage that was taken out on this home.
Original Mortgage
$174,189
Outstanding Balance
$66,352
Interest Rate
7.14%
Mortgage Type
FHA
Estimated Equity
$347,079
Purchase Details
Closed on
Jun 21, 1997
Sold by
Robert Arteaga and Robert Arvie M
Bought by
Arteaga Robert and Arteaga Arvie M
Home Financials for this Owner
Home Financials are based on the most recent Mortgage that was taken out on this home.
Original Mortgage
$31,000
Interest Rate
7.93%
Create a Home Valuation Report for This Property
The Home Valuation Report is an in-depth analysis detailing your home's value as well as a comparison with similar homes in the area
Home Values in the Area
Average Home Value in this Area
Purchase History
| Date | Buyer | Sale Price | Title Company |
|---|---|---|---|
| Galicia Rick | -- | None Available | |
| Galicia Kimberly | -- | None Available | |
| Galicia Rick | $177,000 | Fidelity National Title Co | |
| Arteaga Robert | -- | First American Title Co |
Source: Public Records
Mortgage History
| Date | Status | Borrower | Loan Amount |
|---|---|---|---|
| Open | Galicia Rick | $174,189 | |
| Previous Owner | Arteaga Robert | $31,000 |
Source: Public Records
Tax History Compared to Growth
Tax History
| Year | Tax Paid | Tax Assessment Tax Assessment Total Assessment is a certain percentage of the fair market value that is determined by local assessors to be the total taxable value of land and additions on the property. | Land | Improvement |
|---|---|---|---|---|
| 2025 | $3,258 | $266,164 | $78,349 | $187,815 |
| 2024 | $3,206 | $260,946 | $76,813 | $184,133 |
| 2023 | $3,134 | $255,830 | $75,307 | $180,523 |
| 2022 | $3,085 | $250,815 | $73,831 | $176,984 |
| 2021 | $2,964 | $245,898 | $72,384 | $173,514 |
| 2020 | $3,020 | $243,377 | $71,642 | $171,735 |
| 2019 | $3,007 | $238,606 | $70,238 | $168,368 |
| 2018 | $2,950 | $233,928 | $68,861 | $165,067 |
| 2017 | $2,795 | $229,342 | $67,511 | $161,831 |
| 2016 | $2,845 | $224,845 | $66,187 | $158,658 |
| 2014 | $1,878 | $151,000 | $45,000 | $106,000 |
Source: Public Records
Map
Nearby Homes
- 5271 Barbados Cir
- 5431 Strawberry Way
- 5816 Caribbean Cir
- 5831 Caribbean Cir
- 5813 Fred Russo Dr
- 5718 Krissi Ct
- 1122 Morning Dew Place
- 2321 Bartram Run Way
- 5622 Jeffrey Ct
- 1864 Caleb Cir
- 5250 Foxglove Ct
- 1614 Bonaire Cir
- 1750 Bonaire Cir
- 2709 Etcheverry Dr
- 7028 Tristan Cir
- 6706 Tam o Shanter Dr Unit 45
- 6706 Tam O'Shanter Dr Unit 112
- 6706 Tam o Shanter Dr Unit 61
- 6706 Tam O'Shanter Dr Unit 72
- 6706 Tam o Shanter Dr Unit 126
- 5446 Governor Cir
- 5450 Governor Cir
- 5529 Zaca Ln
- 5551 Zaca Ln
- 5505 Zaca Ln
- 5468 Governor Cir
- 5464 Governor Cir
- 5447 Governor Cir
- 5451 Governor Cir
- 5470 Governor Cir
- 5453 Governor Cir
- 2026 Ulysses St
- 2010 Ulysses St
- 2044 Ulysses St
- 5455 Governor Cir
- 2062 Ulysses St
- 5445 Governor Cir
- 5528 Zaca Ln
- 5504 Zaca Ln
- 2080 Ulysses St