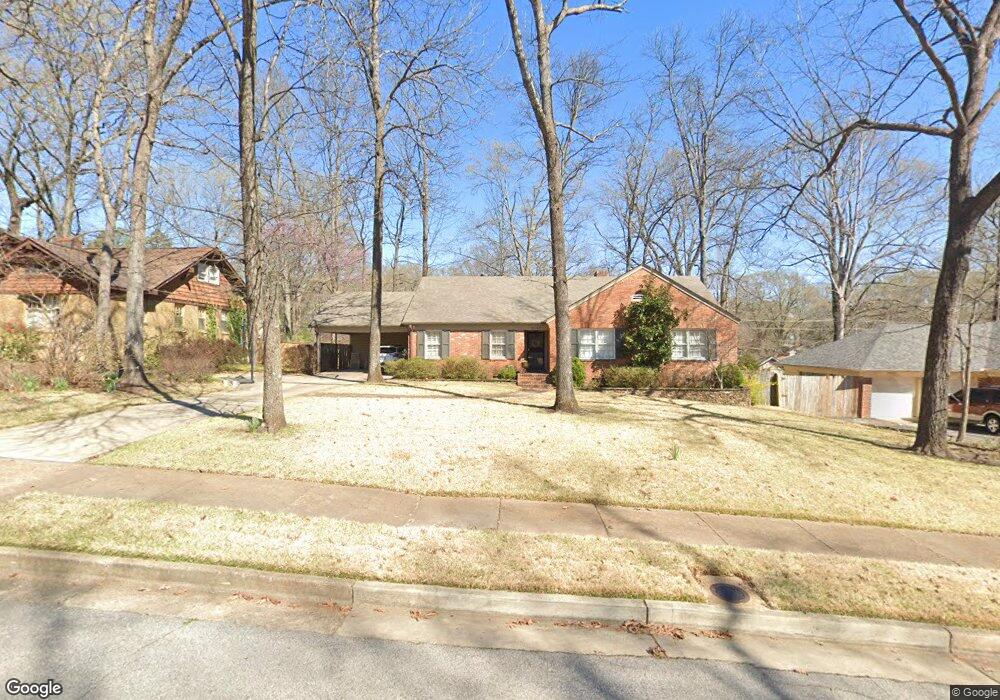
5452 N Rolling Oaks Dr Memphis, TN 38119
Colonial Acres NeighborhoodEstimated Value: $344,350 - $366,000
3
Beds
2
Baths
2,409
Sq Ft
$148/Sq Ft
Est. Value
About This Home
This home is located at 5452 N Rolling Oaks Dr, Memphis, TN 38119 and is currently estimated at $357,088, approximately $148 per square foot. 5452 N Rolling Oaks Dr is a home located in Shelby County with nearby schools including Sea Isle Elementary School, Colonial Middle, and Overton High.
Ownership History
Date
Name
Owned For
Owner Type
Purchase Details
Closed on
Aug 12, 2005
Sold by
Bailey Jason D and Bailey Elizabeth
Bought by
Wilkerson Brett and Wilkerson Emily
Current Estimated Value
Home Financials for this Owner
Home Financials are based on the most recent Mortgage that was taken out on this home.
Original Mortgage
$182,400
Outstanding Balance
$97,045
Interest Rate
5.86%
Mortgage Type
Fannie Mae Freddie Mac
Estimated Equity
$260,043
Purchase Details
Closed on
Aug 11, 2003
Sold by
Ridley Kathryn
Bought by
Bailey Jason D and Bailey Elizabeth E
Home Financials for this Owner
Home Financials are based on the most recent Mortgage that was taken out on this home.
Original Mortgage
$192,850
Interest Rate
4.12%
Mortgage Type
Purchase Money Mortgage
Purchase Details
Closed on
Mar 6, 1998
Sold by
Tiner Wesley A and Tiner Leigh M
Bought by
Ridley Kathryn
Home Financials for this Owner
Home Financials are based on the most recent Mortgage that was taken out on this home.
Original Mortgage
$122,400
Interest Rate
7.07%
Purchase Details
Closed on
Mar 28, 1996
Bought by
Treadwell Carey A and Treadwell Macq
Create a Home Valuation Report for This Property
The Home Valuation Report is an in-depth analysis detailing your home's value as well as a comparison with similar homes in the area
Home Values in the Area
Average Home Value in this Area
Purchase History
| Date | Buyer | Sale Price | Title Company |
|---|---|---|---|
| Wilkerson Brett | $228,000 | -- | |
| Bailey Jason D | $203,000 | -- | |
| Ridley Kathryn | $153,000 | -- | |
| Treadwell Carey A | $139,500 | -- |
Source: Public Records
Mortgage History
| Date | Status | Borrower | Loan Amount |
|---|---|---|---|
| Open | Wilkerson Brett | $182,400 | |
| Previous Owner | Bailey Jason D | $192,850 | |
| Previous Owner | Ridley Kathryn | $122,400 | |
| Closed | Wilkerson Brett | $34,200 |
Source: Public Records
Tax History Compared to Growth
Tax History
| Year | Tax Paid | Tax Assessment Tax Assessment Total Assessment is a certain percentage of the fair market value that is determined by local assessors to be the total taxable value of land and additions on the property. | Land | Improvement |
|---|---|---|---|---|
| 2025 | $2,249 | $88,125 | $17,700 | $70,425 |
| 2024 | $2,249 | $66,350 | $12,675 | $53,675 |
| 2023 | $4,042 | $66,350 | $12,675 | $53,675 |
| 2022 | $4,042 | $66,350 | $12,675 | $53,675 |
| 2021 | $4,089 | $66,350 | $12,675 | $53,675 |
| 2020 | $3,581 | $49,425 | $12,675 | $36,750 |
| 2019 | $3,581 | $49,425 | $12,675 | $36,750 |
| 2018 | $3,581 | $49,425 | $12,675 | $36,750 |
| 2017 | $2,031 | $49,425 | $12,675 | $36,750 |
| 2016 | $2,058 | $47,100 | $0 | $0 |
| 2014 | $2,058 | $47,100 | $0 | $0 |
Source: Public Records
Map
Nearby Homes
- 5478 N Rolling Oaks Dr
- 1220 E Irvin Dr
- 1279 W Crestwood Dr
- 1261 Wesleyan Place
- 1149 E Irvin Dr
- 5367 Shady Breeze Cove
- 5362 Knollwood Cove
- 1190 Estate Dr
- 1121 Park Green Cove
- 1111 Hayne Rd
- 5323 Dee Rd
- 5482 Park Ave
- 5480 Park Ave
- 5476 E East End Village Dr
- 5287 Seneca Ave
- 5492 Park Ave
- 5512 Park Ave
- 5474 Park Ave
- 5283 Dee Rd
- 1090 Estate Dr
- 5442 N Rolling Oaks Dr
- 5460 N Rolling Oaks Dr
- 5445 Glenbrier Ave
- 5445 Glenbriar Dr
- 5457 Glenbriar Dr
- 5432 N Rolling Oaks Dr
- 5470 N Rolling Oaks Dr
- 5453 N Rolling Oaks Dr
- 5453 Rolling Oaks Dr N
- 5435 Glenbriar Dr
- 5445 N Rolling Oaks Dr
- 5463 N Rolling Oaks Dr
- 5467 Glenbriar Dr
- 5435 N Rolling Oaks Dr
- 1258 Hayne Rd
- 5471 N Rolling Oaks Dr
- 1244 Hayne Rd
- 1313 Glen Oaks Dr
- 1280 Hayne Rd
- 5481 Glenbriar Dr