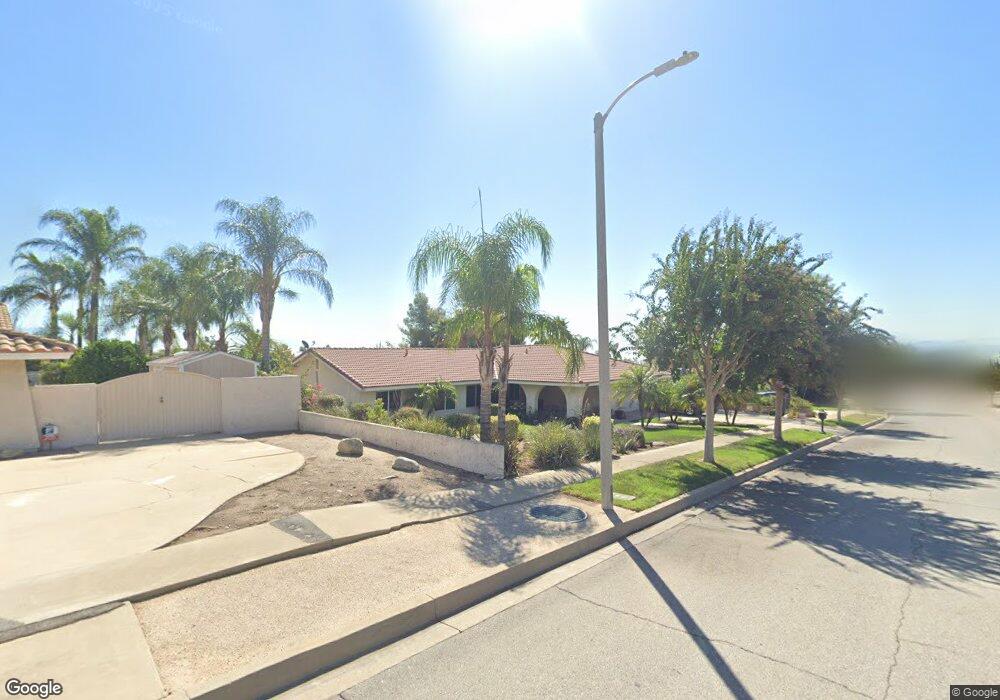
5457 Via Serena Rancho Cucamonga, CA 91701
Estimated Value: $1,101,000 - $1,288,000
4
Beds
2
Baths
2,129
Sq Ft
$548/Sq Ft
Est. Value
About This Home
This home is located at 5457 Via Serena, Rancho Cucamonga, CA 91701 and is currently estimated at $1,167,479, approximately $548 per square foot. 5457 Via Serena is a home located in San Bernardino County with nearby schools including Floyd M. Stork Elementary, Alta Loma Junior High, and Alta Loma High.
Ownership History
Date
Name
Owned For
Owner Type
Purchase Details
Closed on
Nov 16, 2021
Sold by
Carlson Dawna Lynn and Carlson David W
Bought by
Carlson David W and Carlson Dawna Lynn
Current Estimated Value
Home Financials for this Owner
Home Financials are based on the most recent Mortgage that was taken out on this home.
Original Mortgage
$335,000
Outstanding Balance
$285,277
Interest Rate
2.99%
Mortgage Type
New Conventional
Estimated Equity
$882,202
Purchase Details
Closed on
Apr 29, 2008
Sold by
Brown Herbert W
Bought by
Carlson David W and Burt Dawna Lynn
Home Financials for this Owner
Home Financials are based on the most recent Mortgage that was taken out on this home.
Original Mortgage
$415,900
Interest Rate
6%
Mortgage Type
Purchase Money Mortgage
Purchase Details
Closed on
Dec 19, 1996
Sold by
Cascone Anthony R and Cascone Jodie R
Bought by
Brown Herbert W and Brown Mary L
Home Financials for this Owner
Home Financials are based on the most recent Mortgage that was taken out on this home.
Original Mortgage
$139,750
Interest Rate
7.67%
Create a Home Valuation Report for This Property
The Home Valuation Report is an in-depth analysis detailing your home's value as well as a comparison with similar homes in the area
Home Values in the Area
Average Home Value in this Area
Purchase History
| Date | Buyer | Sale Price | Title Company |
|---|---|---|---|
| Carlson David W | -- | First American Title Company | |
| Carlson David W | $520,000 | Chicago Title Company | |
| Brown Herbert W | $215,000 | First American Title Ins Co |
Source: Public Records
Mortgage History
| Date | Status | Borrower | Loan Amount |
|---|---|---|---|
| Open | Carlson David W | $335,000 | |
| Closed | Carlson David W | $415,900 | |
| Previous Owner | Brown Herbert W | $139,750 |
Source: Public Records
Tax History Compared to Growth
Tax History
| Year | Tax Paid | Tax Assessment Tax Assessment Total Assessment is a certain percentage of the fair market value that is determined by local assessors to be the total taxable value of land and additions on the property. | Land | Improvement |
|---|---|---|---|---|
| 2025 | $7,378 | $683,031 | $229,865 | $453,166 |
| 2024 | $7,378 | $669,638 | $225,358 | $444,280 |
| 2023 | $7,212 | $656,508 | $220,939 | $435,569 |
| 2022 | $7,194 | $643,635 | $216,607 | $427,028 |
| 2021 | $7,192 | $631,015 | $212,360 | $418,655 |
| 2020 | $6,895 | $624,545 | $210,183 | $414,362 |
| 2019 | $6,974 | $612,299 | $206,062 | $406,237 |
| 2018 | $6,818 | $600,294 | $202,022 | $398,272 |
| 2017 | $6,506 | $588,524 | $198,061 | $390,463 |
| 2016 | $6,329 | $576,984 | $194,177 | $382,807 |
| 2015 | $6,289 | $568,317 | $191,260 | $377,057 |
| 2014 | $6,111 | $557,184 | $187,513 | $369,671 |
Source: Public Records
Map
Nearby Homes
- 8288 Hillside Rd
- 8309 Hillside Rd
- 8327 La Senda Rd
- 8326 La Senda Rd
- 5327 Topaz St
- 0 Bella Vista Dr Unit CV25069957
- 5291 Carnelian St
- 8291 Jennet St
- 5234 Della Ave
- 8798 Justify Dr
- 5800 Ridgeway Rd
- 5830 Emerald St
- 8915 Appaloosa Ct
- 8986 Whirlaway Ct
- 8967 Citation Ct
- 7950 Gardenia Ave
- 8911 Mustang Rd
- 8010 Rosebud St
- 6073 Cameo St
- 6087 Aquamarine Ave