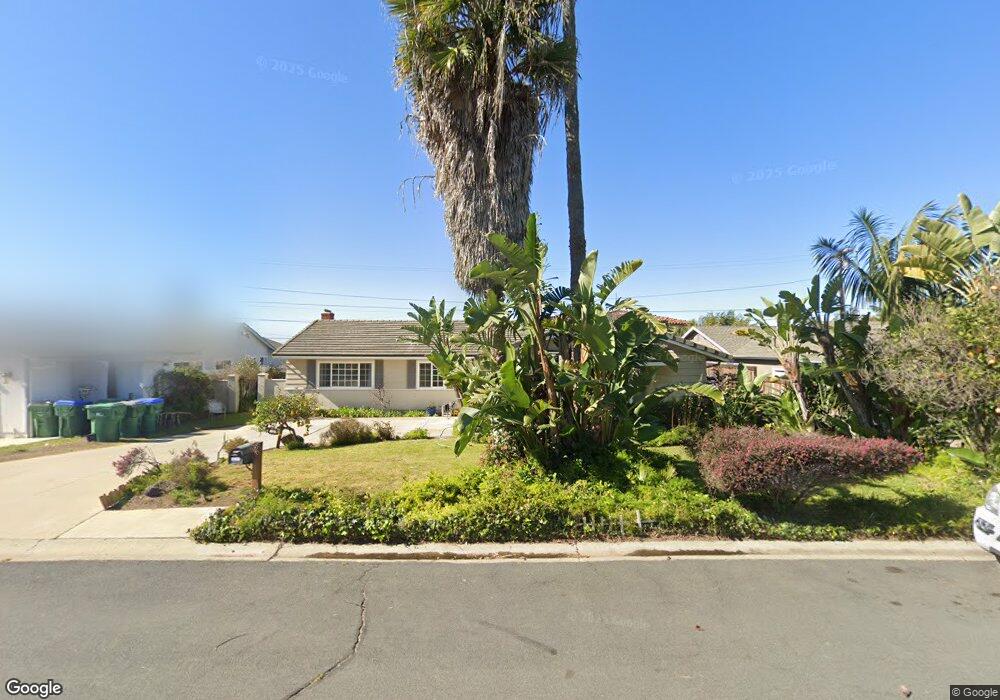
5461 Los Robles Dr Carlsbad, CA 92008
South Beach NeighborhoodEstimated Value: $1,708,484 - $2,439,000
3
Beds
2
Baths
1,651
Sq Ft
$1,303/Sq Ft
Est. Value
About This Home
This home is located at 5461 Los Robles Dr, Carlsbad, CA 92008 and is currently estimated at $2,150,621, approximately $1,302 per square foot. 5461 Los Robles Dr is a home located in San Diego County with nearby schools including Carlsbad High School, Sage Creek High, and Carlsbad Country Day School.
Ownership History
Date
Name
Owned For
Owner Type
Purchase Details
Closed on
Jul 7, 2003
Sold by
Lopez Francis J
Bought by
Lang Gary
Current Estimated Value
Home Financials for this Owner
Home Financials are based on the most recent Mortgage that was taken out on this home.
Original Mortgage
$560,000
Outstanding Balance
$233,416
Interest Rate
5%
Mortgage Type
New Conventional
Estimated Equity
$1,917,205
Purchase Details
Closed on
Jun 11, 2003
Sold by
Lopez Francis J and Lopez Madeleine Magill
Bought by
Lopez Francis J
Home Financials for this Owner
Home Financials are based on the most recent Mortgage that was taken out on this home.
Original Mortgage
$560,000
Outstanding Balance
$233,416
Interest Rate
5%
Mortgage Type
New Conventional
Estimated Equity
$1,917,205
Purchase Details
Closed on
Jun 11, 1996
Sold by
Turro Paul J and Joel Paul
Bought by
Lopez Francis J and Lopez Madeleine Magill
Purchase Details
Closed on
Feb 1, 1990
Create a Home Valuation Report for This Property
The Home Valuation Report is an in-depth analysis detailing your home's value as well as a comparison with similar homes in the area
Home Values in the Area
Average Home Value in this Area
Purchase History
| Date | Buyer | Sale Price | Title Company |
|---|---|---|---|
| Lang Gary | $700,000 | Chicago Title Co | |
| Lopez Francis J | -- | American Title Co | |
| Lopez Francis J | -- | Chicago Title Co | |
| -- | $350,000 | -- |
Source: Public Records
Mortgage History
| Date | Status | Borrower | Loan Amount |
|---|---|---|---|
| Open | Lang Gary | $560,000 | |
| Closed | Lopez Francis J | $498,750 | |
| Closed | Lopez Francis J | $33,250 |
Source: Public Records
Tax History
| Year | Tax Paid | Tax Assessment Tax Assessment Total Assessment is a certain percentage of the fair market value that is determined by local assessors to be the total taxable value of land and additions on the property. | Land | Improvement |
|---|---|---|---|---|
| 2025 | $10,385 | $995,246 | $710,891 | $284,355 |
| 2024 | $10,385 | $975,732 | $696,952 | $278,780 |
| 2023 | $10,331 | $956,601 | $683,287 | $273,314 |
| 2022 | $10,171 | $937,845 | $669,890 | $267,955 |
| 2021 | $10,093 | $919,456 | $656,755 | $262,701 |
| 2020 | $10,025 | $910,029 | $650,021 | $260,008 |
| 2019 | $9,843 | $892,186 | $637,276 | $254,910 |
| 2018 | $9,426 | $874,693 | $624,781 | $249,912 |
| 2017 | $9,269 | $857,543 | $612,531 | $245,012 |
| 2016 | $8,896 | $840,729 | $600,521 | $240,208 |
| 2015 | $8,859 | $828,101 | $591,501 | $236,600 |
| 2014 | $8,710 | $811,881 | $579,915 | $231,966 |
Source: Public Records
Map
Nearby Homes
- 5380 Los Robles Dr
- 5303 Los Robles Dr
- 5238 Carlsbad Blvd
- 5183 El Arbol Dr
- 5170 Carlsbad Blvd
- 5143 Shore Dr
- 5091 El Arbol Dr
- 6536 Oceanview Dr Unit T
- 6506 Oceanview Dr
- 6494 Friendly Place
- 6503 Friendly Place
- 3056 & 3162 Carlsbad Blvd
- 6610 Easy St
- 4747 Marina Dr Unit 23
- 0 Adams St Unit OC24201399
- 4759 Bryce Cir
- 4705 Marina Dr Unit 7
- 4705 Marina Dr Unit 10
- 4735 Bryce Cir
- 4556 Cove Dr
- 5471 Los Robles Dr
- 5451 Los Robles Dr
- 5460 Carlsbad Blvd
- 5462 Carlsbad Blvd
- 5481 Los Robles Dr
- 5441 Los Robles Dr
- 5470 Los Robles Dr
- 5460 Los Robles Dr
- 5480 Los Robles Dr
- 5440 Carlsbad Blvd
- 5450 Los Robles Dr
- 5464 Carlsbad Blvd
- 5431 Los Robles Dr
- 5491 Los Robles Dr
- 5490 Los Robles Dr
- 5440 Los Robles Dr
- 5430 Carlsbad B
- 5430 Carlsbad Blvd
- 5480 Carlsbad Blvd
- 5485 El Arbol Dr
Your Personal Tour Guide
Ask me questions while you tour the home.