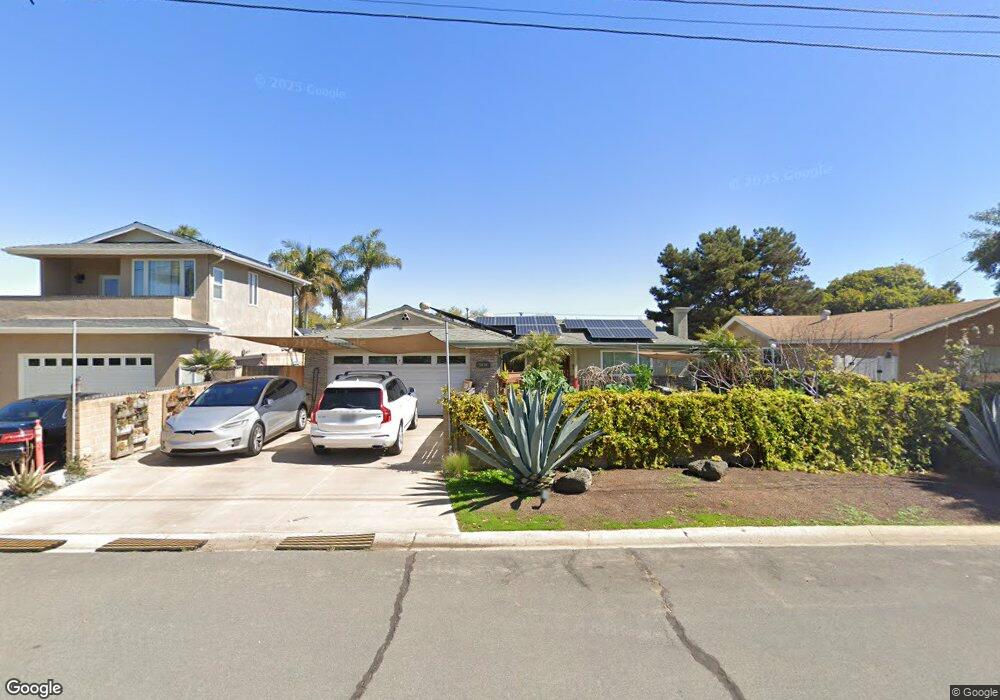
5470 El Arbol Dr Carlsbad, CA 92008
South Beach NeighborhoodEstimated Value: $1,667,056 - $2,192,000
4
Beds
3
Baths
1,684
Sq Ft
$1,178/Sq Ft
Est. Value
About This Home
This home is located at 5470 El Arbol Dr, Carlsbad, CA 92008 and is currently estimated at $1,983,764, approximately $1,178 per square foot. 5470 El Arbol Dr is a home located in San Diego County with nearby schools including Carlsbad High School, Sage Creek High, and St. Patrick Catholic School.
Ownership History
Date
Name
Owned For
Owner Type
Purchase Details
Closed on
Oct 8, 2002
Sold by
Grangetto Judit Sarvari
Bought by
Grangetto Frank N
Current Estimated Value
Home Financials for this Owner
Home Financials are based on the most recent Mortgage that was taken out on this home.
Original Mortgage
$248,000
Interest Rate
5.39%
Purchase Details
Closed on
Mar 8, 2001
Sold by
Grangetto Frank N and Nelson Frank M
Bought by
Grangetto Frank N
Home Financials for this Owner
Home Financials are based on the most recent Mortgage that was taken out on this home.
Original Mortgage
$250,000
Interest Rate
7.06%
Purchase Details
Closed on
Mar 24, 1998
Sold by
Brown Alice
Bought by
Nelson Frank M
Home Financials for this Owner
Home Financials are based on the most recent Mortgage that was taken out on this home.
Original Mortgage
$184,000
Interest Rate
7.06%
Create a Home Valuation Report for This Property
The Home Valuation Report is an in-depth analysis detailing your home's value as well as a comparison with similar homes in the area
Home Values in the Area
Average Home Value in this Area
Purchase History
| Date | Buyer | Sale Price | Title Company |
|---|---|---|---|
| Grangetto Frank N | -- | First American Title | |
| Grangetto Frank N | -- | Chicago Title Co | |
| Nelson Frank M | $230,000 | Chicago Title Co |
Source: Public Records
Mortgage History
| Date | Status | Borrower | Loan Amount |
|---|---|---|---|
| Closed | Grangetto Frank N | $248,000 | |
| Closed | Grangetto Frank N | $250,000 | |
| Closed | Nelson Frank M | $184,000 |
Source: Public Records
Tax History Compared to Growth
Tax History
| Year | Tax Paid | Tax Assessment Tax Assessment Total Assessment is a certain percentage of the fair market value that is determined by local assessors to be the total taxable value of land and additions on the property. | Land | Improvement |
|---|---|---|---|---|
| 2025 | $4,425 | $422,988 | $319,342 | $103,646 |
| 2024 | $4,425 | $414,695 | $313,081 | $101,614 |
| 2023 | $4,401 | $406,565 | $306,943 | $99,622 |
| 2022 | $4,332 | $398,594 | $300,925 | $97,669 |
| 2021 | $4,299 | $390,779 | $295,025 | $95,754 |
| 2020 | $4,269 | $386,773 | $292,000 | $94,773 |
| 2019 | $4,192 | $379,190 | $286,275 | $92,915 |
| 2018 | $4,016 | $371,756 | $280,662 | $91,094 |
| 2017 | $3,948 | $364,467 | $275,159 | $89,308 |
| 2016 | $3,789 | $357,321 | $269,764 | $87,557 |
| 2015 | $3,773 | $351,954 | $265,712 | $86,242 |
| 2014 | $3,710 | $345,061 | $260,508 | $84,553 |
Source: Public Records
Map
Nearby Homes
- 5390 Carlsbad Blvd
- 5335 Los Robles Dr
- 5301 Los Robles Dr
- 5183 El Arbol Dr
- 5140 Los Robles Dr
- 5143 Shore Dr
- 6536 Oceanview Dr Unit T
- 6494 Friendly Place
- 6508 Easy St Unit T
- 6503 Friendly Place
- 3056 & 3162 Carlsbad Blvd
- 4747 Marina Dr Unit 23
- 0 Adams St Unit OC24201399
- 4705 Marina Dr Unit 10
- 4735 Bryce Cir
- 811 Caminito Del Sol
- 4781 Argosy Ln
- 4843 Flying Cloud Way
- 909 Caminito Madrigal Unit B
- 901 Caminito Estrada Unit C
- 5480 El Arbol Dr
- 5460 El Arbol Dr
- 5450 El Arbol Dr
- 5490 El Arbol Dr
- 5475 El Arbol Dr
- 5465 El Arbol Dr
- 5485 El Arbol Dr
- 5440 El Arbol Dr
- 5500 El Arbol Dr
- 5455 El Arbol Dr
- 5495 El Arbol Dr
- 5430 El Arbol Dr
- 5445 El Arbol Dr
- 5510 El Arbol Dr
- 5460 Los Robles Dr
- 5450 Los Robles Dr
- 5505 El Arbol Dr
- 5470 Los Robles Dr
- 5440 Los Robles Dr
- 5435 El Arbol Dr