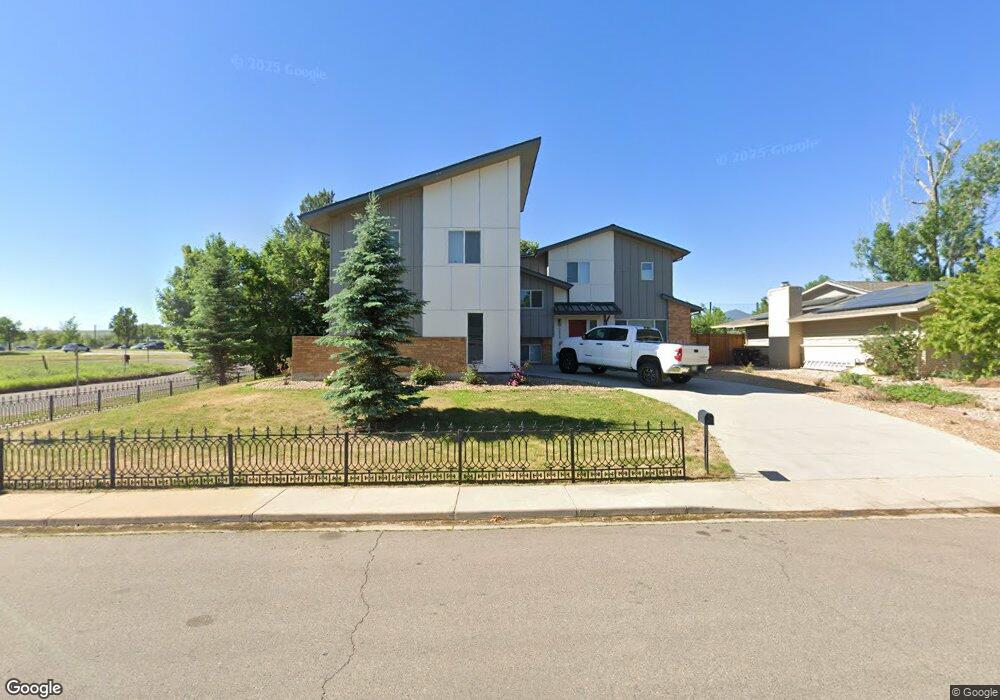
5488 Omaha Place Boulder, CO 80303
Southeast Boulder NeighborhoodEstimated Value: $1,121,000 - $1,394,000
3
Beds
4
Baths
2,239
Sq Ft
$544/Sq Ft
Est. Value
About This Home
This home is located at 5488 Omaha Place, Boulder, CO 80303 and is currently estimated at $1,218,440, approximately $544 per square foot. 5488 Omaha Place is a home located in Boulder County with nearby schools including Eisenhower Elementary School, Manhattan Middle School of the Arts & Academics, and Fairview High School.
Ownership History
Date
Name
Owned For
Owner Type
Purchase Details
Closed on
Jul 24, 2015
Sold by
Jallad Sami and Estate Of Armande Jallad
Bought by
Jallad Sami
Current Estimated Value
Home Financials for this Owner
Home Financials are based on the most recent Mortgage that was taken out on this home.
Original Mortgage
$417,000
Outstanding Balance
$327,520
Interest Rate
4.07%
Mortgage Type
New Conventional
Estimated Equity
$890,920
Purchase Details
Closed on
May 28, 2014
Sold by
Jallad Sami and Estate Of Armande Jallad
Bought by
Jallad Sami and Estate Of Armande Jallad
Purchase Details
Closed on
Jul 30, 1990
Bought by
Jallad Sami
Purchase Details
Closed on
Oct 7, 1983
Bought by
Jallad Sami
Purchase Details
Closed on
Aug 4, 1981
Bought by
Jallad Sami
Purchase Details
Closed on
Mar 30, 1979
Bought by
Jallad Sami
Create a Home Valuation Report for This Property
The Home Valuation Report is an in-depth analysis detailing your home's value as well as a comparison with similar homes in the area
Home Values in the Area
Average Home Value in this Area
Purchase History
| Date | Buyer | Sale Price | Title Company |
|---|---|---|---|
| Jallad Sami | -- | Stewart Title | |
| Jallad Sami | -- | None Available | |
| Jallad Sami | -- | -- | |
| Jallad Sami | $126,500 | -- | |
| Jallad Sami | $122,500 | -- | |
| Jallad Sami | $86,000 | -- |
Source: Public Records
Mortgage History
| Date | Status | Borrower | Loan Amount |
|---|---|---|---|
| Open | Jallad Sami | $417,000 |
Source: Public Records
Tax History
| Year | Tax Paid | Tax Assessment Tax Assessment Total Assessment is a certain percentage of the fair market value that is determined by local assessors to be the total taxable value of land and additions on the property. | Land | Improvement |
|---|---|---|---|---|
| 2025 | $7,536 | $78,744 | $42,819 | $35,925 |
| 2024 | $7,536 | $78,744 | $42,819 | $35,925 |
| 2023 | $7,405 | $85,747 | $51,650 | $37,781 |
| 2022 | $6,233 | $67,117 | $37,176 | $29,941 |
| 2021 | $5,943 | $69,047 | $38,245 | $30,802 |
| 2020 | $5,571 | $64,007 | $31,174 | $32,833 |
| 2019 | $5,486 | $64,007 | $31,174 | $32,833 |
| 2018 | $5,158 | $59,494 | $28,944 | $30,550 |
| 2017 | $4,997 | $65,773 | $31,999 | $33,774 |
| 2016 | $3,423 | $39,545 | $20,616 | $18,929 |
| 2015 | $3,242 | $33,942 | $16,398 | $17,544 |
| 2014 | $2,918 | $33,942 | $16,398 | $17,544 |
Source: Public Records
Map
Nearby Homes
- 210 Manhattan Dr
- 167 Cherokee Way
- 600 Manhattan Dr Unit A7
- 501 Manhattan Dr Unit 101
- 655 Cree Cir
- 5648 Baseline Rd
- 625 Manhattan Place Unit 308
- 665 Manhattan Dr Unit 9
- 40 S Boulder Cir Unit 4034
- 30 S Boulder Cir Unit 3018
- 5550 Stonewall Place Unit 33
- 20 S Boulder Cir Unit 20-2204
- 33 S Boulder Cir Unit 316
- 33 S Boulder Cir Unit 306
- 4800 Osage Dr Unit B-16
- 695 Manhattan Dr Unit 116
- 695 Manhattan Dr Unit 109
- 695 Manhattan Dr Unit 219
- 4521 Navajo Place
- 15 Pawnee Dr
- 5478 Omaha Place
- 5468 Omaha Place
- 5491 Omaha Place
- 5473 Omaha Place
- 5461 Omaha Place
- 5454 Omaha Place
- 5492 Pueblo Place
- 5449 Omaha Place
- 5482 Pueblo Place
- 5438 Omaha Place
- 5472 Pueblo Place
- 5431 Omaha Place
- 5462 Pueblo Place
- 5422 Omaha Place
- 5419 Omaha Place
- 5452 Pueblo Place
- 5493 Pueblo Place
- 5483 Pueblo Place
- 5408 Omaha Place
- 5473 Pueblo Place
Your Personal Tour Guide
Ask me questions while you tour the home.