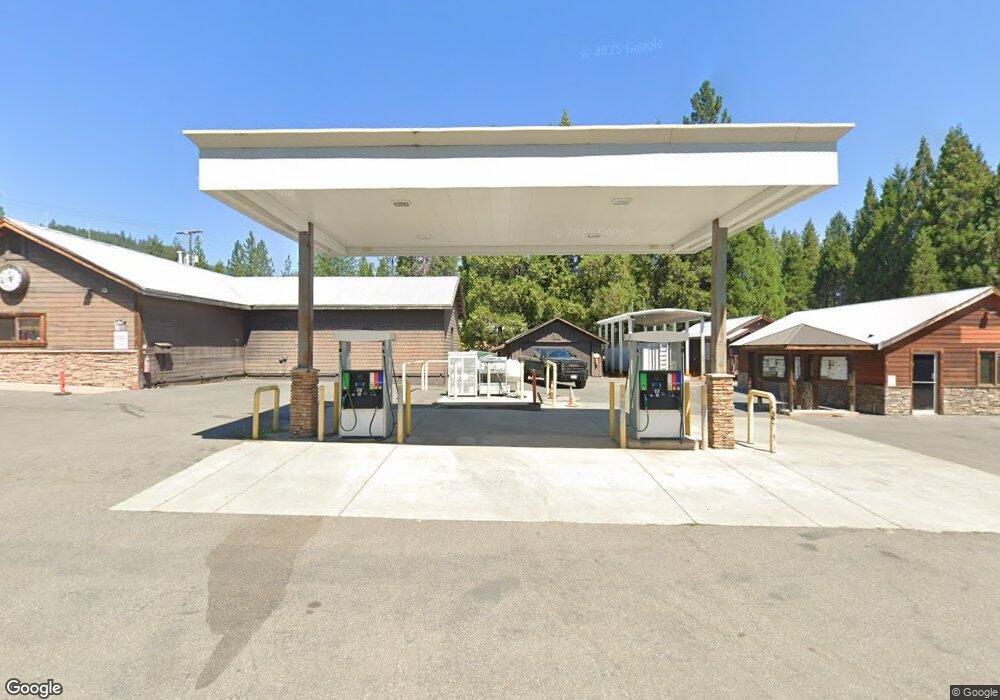
55 Scott Blvd Trinity Center, CA 96091
Studio
--
Bath
3,663
Sq Ft
22,651
Sq Ft Lot
About This Home
This home is located at 55 Scott Blvd, Trinity Center, CA 96091. 55 Scott Blvd is a home located in Trinity County with nearby schools including Trinity Center Elementary, Weaverville Elementary School, and Trinity High School.
Ownership History
Date
Name
Owned For
Owner Type
Purchase Details
Closed on
Aug 25, 2011
Sold by
Umpqua Bank
Bought by
Zabel Justin E
Purchase Details
Closed on
Feb 3, 2011
Sold by
Berkowitz Bernard and Berkowitz Marcia
Bought by
Umpqua Bank
Purchase Details
Closed on
Feb 20, 2003
Sold by
Meyer Jerald A and Meyer Judith
Bought by
Berkowitz Bernard and Berkowitz Marcia
Home Financials for this Owner
Home Financials are based on the most recent Mortgage that was taken out on this home.
Original Mortgage
$300,000
Interest Rate
5.93%
Mortgage Type
Commercial
Create a Home Valuation Report for This Property
The Home Valuation Report is an in-depth analysis detailing your home's value as well as a comparison with similar homes in the area
Purchase History
| Date | Buyer | Sale Price | Title Company |
|---|---|---|---|
| Zabel Justin E | $150,000 | Trinity Co Title Co | |
| Umpqua Bank | $162,622 | First American Title Company | |
| Berkowitz Bernard | $425,000 | Trinity Co Title Co |
Source: Public Records
Mortgage History
| Date | Status | Borrower | Loan Amount |
|---|---|---|---|
| Previous Owner | Berkowitz Bernard | $300,000 | |
| Closed | Berkowitz Bernard | $150,000 |
Source: Public Records
Tax History
| Year | Tax Paid | Tax Assessment Tax Assessment Total Assessment is a certain percentage of the fair market value that is determined by local assessors to be the total taxable value of land and additions on the property. | Land | Improvement |
|---|---|---|---|---|
| 2025 | $2,952 | $297,815 | $53,135 | $244,680 |
| 2024 | $2,902 | $286,181 | $52,094 | $234,087 |
| 2023 | $2,902 | $280,571 | $51,073 | $229,498 |
| 2022 | $2,763 | $268,204 | $50,072 | $218,132 |
| 2021 | $2,682 | $259,552 | $49,091 | $210,461 |
| 2020 | $2,606 | $254,609 | $48,588 | $206,021 |
| 2019 | $2,371 | $231,618 | $47,636 | $183,982 |
| 2018 | $1,709 | $169,245 | $46,702 | $122,543 |
| 2017 | $1,708 | $166,391 | $45,787 | $120,604 |
| 2016 | $1,645 | $163,593 | $44,890 | $118,703 |
| 2015 | $1,623 | $161,492 | $44,216 | $117,276 |
| 2014 | $1,605 | $158,792 | $43,350 | $115,442 |
Source: Public Records
Map
Nearby Homes
- 71 Mary
- 230 Mary Ave
- 250 Mary Ave
- 79402 California 3
- 230 N Lakeview Dr
- 220 & 230 Lakeview
- 220 & 230 Lakeview Dr
- 268 Placer Dr
- 279 Placer Dr
- 8341 E Side Rd
- 8341 E East Side Rd
- 10 Estabrook Ln
- 151 Guy Covington Dr
- 141 Mountain Aire Rd
- 121, 141 Mountain Aire Rd
- 121 Mountain Aire Ln
- 490 Bear Paw Trail
- 340 Lake Forest Dr
- 410 Lake Forest Dr
- 399 & 410 Lake Forest Dr
Your Personal Tour Guide
Ask me questions while you tour the home.