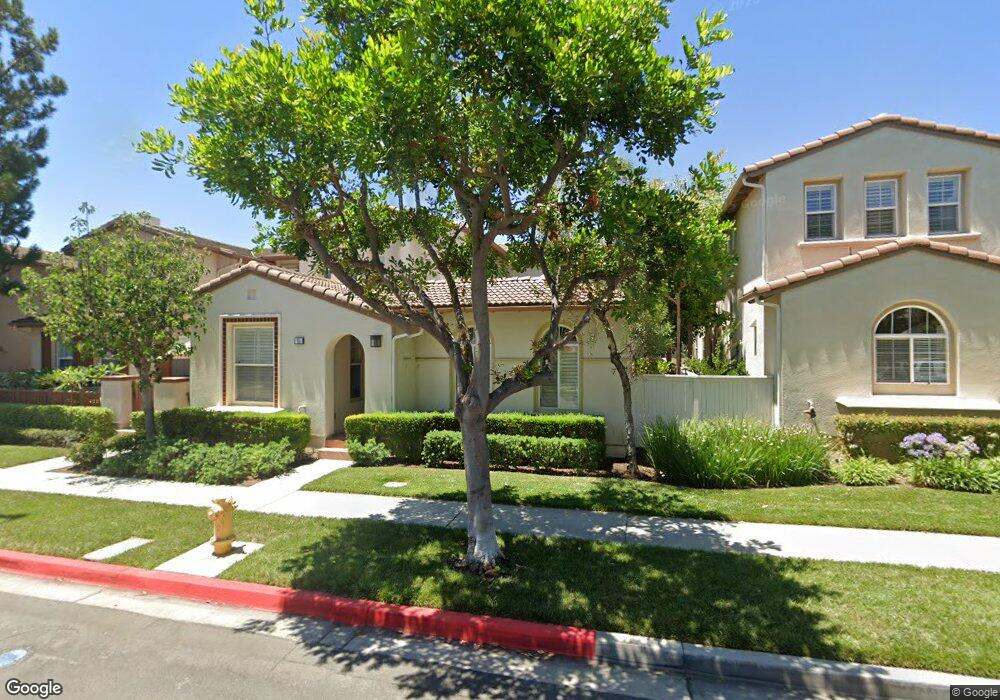
55 Waterman Unit 8 Irvine, CA 92602
Lower Peters Canyon NeighborhoodEstimated Value: $1,216,000 - $1,494,000
2
Beds
2
Baths
2,363
Sq Ft
$581/Sq Ft
Est. Value
About This Home
This home is located at 55 Waterman Unit 8, Irvine, CA 92602 and is currently estimated at $1,373,123, approximately $581 per square foot. 55 Waterman Unit 8 is a home located in Orange County with nearby schools including Myford Elementary School, Pioneer Middle School, and Arnold O. Beckman High School.
Ownership History
Date
Name
Owned For
Owner Type
Purchase Details
Closed on
Apr 11, 2022
Sold by
Merle Stocks Susan
Bought by
Stocks Susan Merle
Current Estimated Value
Purchase Details
Closed on
Oct 21, 2011
Sold by
Stocks Susan Merle and Chips Ray Edward
Bought by
Stocks Susan Merle and Chips Raymond Edward
Home Financials for this Owner
Home Financials are based on the most recent Mortgage that was taken out on this home.
Original Mortgage
$270,800
Interest Rate
4.01%
Mortgage Type
New Conventional
Purchase Details
Closed on
Mar 19, 2001
Sold by
Wl Homes Llc
Bought by
Stocks Susan and Chips Ray
Home Financials for this Owner
Home Financials are based on the most recent Mortgage that was taken out on this home.
Original Mortgage
$311,450
Interest Rate
7.14%
Create a Home Valuation Report for This Property
The Home Valuation Report is an in-depth analysis detailing your home's value as well as a comparison with similar homes in the area
Home Values in the Area
Average Home Value in this Area
Purchase History
| Date | Buyer | Sale Price | Title Company |
|---|---|---|---|
| Stocks Susan Merle | -- | None Listed On Document | |
| Stocks Susan Merle | -- | First American Title Company | |
| Stocks Susan | $389,500 | First American Title Co |
Source: Public Records
Mortgage History
| Date | Status | Borrower | Loan Amount |
|---|---|---|---|
| Previous Owner | Stocks Susan Merle | $270,800 | |
| Previous Owner | Stocks Susan | $311,450 |
Source: Public Records
Tax History Compared to Growth
Tax History
| Year | Tax Paid | Tax Assessment Tax Assessment Total Assessment is a certain percentage of the fair market value that is determined by local assessors to be the total taxable value of land and additions on the property. | Land | Improvement |
|---|---|---|---|---|
| 2025 | $6,498 | $586,602 | $275,931 | $310,671 |
| 2024 | $6,498 | $575,100 | $270,520 | $304,580 |
| 2023 | $6,376 | $563,824 | $265,216 | $298,608 |
| 2022 | $6,251 | $552,769 | $260,016 | $292,753 |
| 2021 | $6,313 | $541,931 | $254,918 | $287,013 |
| 2020 | $6,576 | $536,375 | $252,304 | $284,071 |
| 2019 | $6,436 | $525,858 | $247,357 | $278,501 |
| 2018 | $6,305 | $515,548 | $242,507 | $273,041 |
| 2017 | $6,166 | $505,440 | $237,752 | $267,688 |
| 2016 | $6,067 | $495,530 | $233,090 | $262,440 |
| 2015 | $5,918 | $488,087 | $229,589 | $258,498 |
| 2014 | $5,821 | $478,527 | $225,092 | $253,435 |
Source: Public Records
Map
Nearby Homes
- 47 Robinson Dr Unit 69
- 45 Avondale Unit 26
- 10 Calais
- 12709 Trent Jones Ln
- 2832 Ballesteros Ln
- 2827 Player Ln
- 9 Bonsall Unit 61
- 33 Modesto
- 2960 Champion Way Unit 609
- 2960 Champion Way Unit 1208
- 2960 Champion Way Unit 1814
- 2960 Champion Way Unit 1006
- 20 Bodega Bay
- 23 Red Coat Place
- 32 Montclair
- 0 0 Unit 202512306
- 2800 Keller Dr Unit 55
- 2800 Keller Dr Unit 110
- 2800 Keller Dr Unit 197
- 2800 Keller Dr Unit 80