
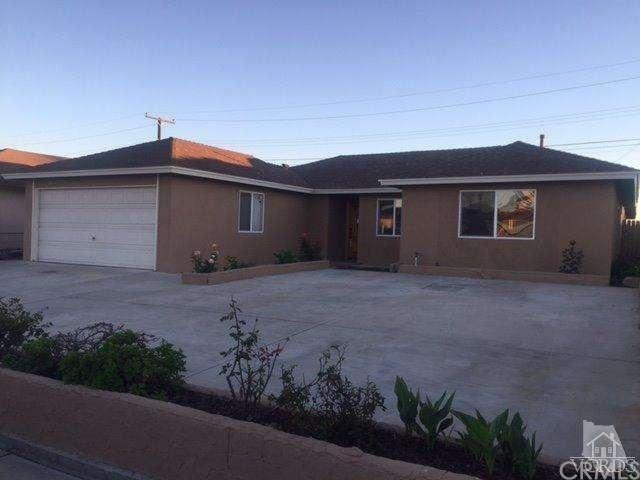
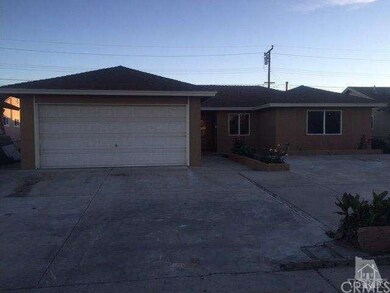
550 E Yucca St Oxnard, CA 93033
Blackstock South Neighborhood
4
Beds
2
Baths
1,800
Sq Ft
6,222
Sq Ft Lot
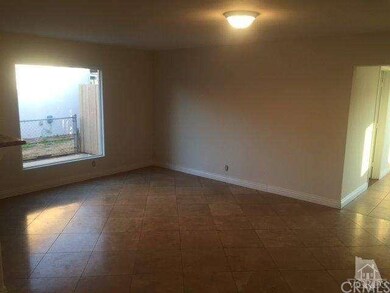
About This Home
As of May 2015This home is located at 550 E Yucca St, Oxnard, CA 93033 and is currently priced at $390,000, approximately $216 per square foot. This property was built in 1962. 550 E Yucca St is a home located in Ventura County with nearby schools including Fred L. Williams Elementary School, Channel Islands High School, and St. Anthony's Elementary School.
Last Agent to Sell the Property
Jared Jones
JSAMJ Inc License #01822924
Home Details
Home Type
- Single Family
Est. Annual Taxes
- $6,195
Year Built
- Built in 1962
Lot Details
- 6,222 Sq Ft Lot
- Property is zoned R1
Parking
- 2 Car Garage
Interior Spaces
- 1,800 Sq Ft Home
- Wood Flooring
Bedrooms and Bathrooms
- 4 Bedrooms
- 2 Full Bathrooms
Listing and Financial Details
- Assessor Parcel Number 2190364065
Ownership History
Date
Name
Owned For
Owner Type
Purchase Details
Listed on
Jan 20, 2015
Closed on
Apr 20, 2015
Sold by
Jsamj Inc
Bought by
Simental Roman Alvarez and Alvarez Sonia
Seller's Agent
Jared Jones
JSAMJ Inc
Buyer's Agent
Lissa Hewitt
Keller Williams West Ventura County
List Price
$379,900
Sold Price
$390,000
Premium/Discount to List
$10,100
2.66%
Current Estimated Value
Home Financials for this Owner
Home Financials are based on the most recent Mortgage that was taken out on this home.
Estimated Appreciation
$372,206
Avg. Annual Appreciation
6.90%
Original Mortgage
$373,117
Outstanding Balance
$293,465
Interest Rate
3.87%
Mortgage Type
FHA
Estimated Equity
$468,741
Purchase Details
Closed on
Jul 25, 2014
Sold by
Jones Jared
Bought by
Jsamj Inc
Purchase Details
Closed on
Oct 30, 2012
Sold by
Hernandez Pedro A
Bought by
Jones Jared
Home Financials for this Owner
Home Financials are based on the most recent Mortgage that was taken out on this home.
Original Mortgage
$207,735
Interest Rate
3.35%
Mortgage Type
Unknown
Purchase Details
Closed on
Nov 16, 2011
Sold by
Hernandez Pedro
Bought by
P G Inter Vivos Trust
Purchase Details
Closed on
Apr 13, 2007
Sold by
Hernandez Jose Luis
Bought by
Hernandez Pedro A
Home Financials for this Owner
Home Financials are based on the most recent Mortgage that was taken out on this home.
Original Mortgage
$57,442
Interest Rate
6.14%
Mortgage Type
Stand Alone Second
Purchase Details
Closed on
Mar 10, 2005
Sold by
Hernandez Shari
Bought by
Hernandez Jose Luis
Home Financials for this Owner
Home Financials are based on the most recent Mortgage that was taken out on this home.
Original Mortgage
$400,000
Interest Rate
6.87%
Mortgage Type
Purchase Money Mortgage
Purchase Details
Closed on
Mar 7, 2005
Sold by
Sabangan Esmenia
Bought by
Hernandez Pedro A and Hernandez Jose Luis
Home Financials for this Owner
Home Financials are based on the most recent Mortgage that was taken out on this home.
Original Mortgage
$400,000
Interest Rate
6.87%
Mortgage Type
Purchase Money Mortgage
Purchase Details
Closed on
Feb 28, 2005
Sold by
Pinzon Lopez Anabel
Bought by
Sabangan Esmenia
Home Financials for this Owner
Home Financials are based on the most recent Mortgage that was taken out on this home.
Original Mortgage
$400,000
Interest Rate
6.87%
Mortgage Type
Purchase Money Mortgage
Purchase Details
Closed on
Apr 5, 2004
Sold by
Sabangan Esmenia C
Bought by
Pinzon Lopez Anabel
Purchase Details
Closed on
Jan 4, 2003
Sold by
Sabangan Juanito P
Bought by
Sabangan Esmenia
Home Financials for this Owner
Home Financials are based on the most recent Mortgage that was taken out on this home.
Original Mortgage
$236,000
Interest Rate
6.15%
Purchase Details
Closed on
Aug 10, 2000
Sold by
Leo S Cantada Santos
Bought by
Sabangan Juanito P and Sabangan Esmenia C
Home Financials for this Owner
Home Financials are based on the most recent Mortgage that was taken out on this home.
Original Mortgage
$184,500
Interest Rate
9.5%
Purchase Details
Closed on
Jan 29, 1999
Sold by
Santos Cantada
Bought by
Cantada Santos and Cantada Milagros
Purchase Details
Closed on
Oct 2, 1993
Sold by
Canan Felix M and Ramirez Rolando J
Bought by
Cantada Santos and Cantada Milagros
Map
Create a Home Valuation Report for This Property
The Home Valuation Report is an in-depth analysis detailing your home's value as well as a comparison with similar homes in the area
Similar Homes in Oxnard, CA
Home Values in the Area
Average Home Value in this Area
Purchase History
| Date | Type | Sale Price | Title Company |
|---|---|---|---|
| Grant Deed | $390,000 | Stewart Title Of Ca Inc | |
| Grant Deed | -- | Accommodation | |
| Grant Deed | $200,000 | Priority Title | |
| Grant Deed | -- | None Available | |
| Grant Deed | $259,000 | Chicago Title Company | |
| Interfamily Deed Transfer | -- | Fidelity National Title | |
| Interfamily Deed Transfer | -- | Fidelity National Title | |
| Interfamily Deed Transfer | -- | Fidelity National Title | |
| Grant Deed | $500,000 | Fidelity National Title | |
| Grant Deed | -- | Fidelity National Title | |
| Grant Deed | -- | -- | |
| Interfamily Deed Transfer | -- | Stewart Title Company | |
| Grant Deed | $205,000 | Stewart Title | |
| Gift Deed | -- | Chicago Title Co | |
| Quit Claim Deed | -- | -- |
Source: Public Records
Mortgage History
| Date | Status | Loan Amount | Loan Type |
|---|---|---|---|
| Open | $373,117 | FHA | |
| Previous Owner | $207,735 | Unknown | |
| Previous Owner | $57,442 | Stand Alone Second | |
| Previous Owner | $460,000 | Purchase Money Mortgage | |
| Previous Owner | $400,000 | Purchase Money Mortgage | |
| Previous Owner | $236,000 | No Value Available | |
| Previous Owner | $184,500 | No Value Available | |
| Closed | $100,000 | No Value Available |
Source: Public Records
Property History
| Date | Event | Price | Change | Sq Ft Price |
|---|---|---|---|---|
| 05/15/2015 05/15/15 | Sold | $390,000 | +2.7% | $217 / Sq Ft |
| 02/16/2015 02/16/15 | For Sale | $379,900 | +96.8% | $211 / Sq Ft |
| 01/28/2015 01/28/15 | Pending | -- | -- | -- |
| 08/03/2012 08/03/12 | Sold | $193,000 | 0.0% | $161 / Sq Ft |
| 03/08/2012 03/08/12 | Off Market | $193,000 | -- | -- |
| 01/13/2012 01/13/12 | Off Market | $193,000 | -- | -- |
| 12/22/2011 12/22/11 | For Sale | $140,000 | -- | $117 / Sq Ft |
Source: Ventura County Regional Data Share
Tax History
| Year | Tax Paid | Tax Assessment Tax Assessment Total Assessment is a certain percentage of the fair market value that is determined by local assessors to be the total taxable value of land and additions on the property. | Land | Improvement |
|---|---|---|---|---|
| 2024 | $6,195 | $508,670 | $298,691 | $209,979 |
| 2023 | $5,455 | $466,340 | $292,835 | $173,505 |
| 2022 | $5,343 | $457,197 | $287,094 | $170,103 |
| 2021 | $5,410 | $448,233 | $281,465 | $166,768 |
| 2020 | $5,324 | $428,582 | $278,579 | $150,003 |
| 2019 | $5,164 | $420,179 | $273,117 | $147,062 |
| 2018 | $4,974 | $411,941 | $267,762 | $144,179 |
| 2017 | $4,813 | $403,864 | $262,512 | $141,352 |
| 2016 | $4,583 | $395,946 | $257,365 | $138,581 |
| 2015 | $3,946 | $330,000 | $214,500 | $115,500 |
| 2014 | -- | $286,292 | $143,146 | $143,146 |
Source: Public Records
Source: Ventura County Regional Data Share
MLS Number: V0-215000988
APN: 219-0-364-065
Disclaimer: Certain information contained herein is derived from information provided by parties other than Homes.com. All information provided is deemed reliable, but is not guaranteed to be accurate and should be independently verified.
![]() IDX information is provided exclusively for personal, non-commercial use, and may not be used for any purpose other than to identify prospective properties consumers may be interested in purchasing. Information is deemed reliable but not guaranteed.
IDX information is provided exclusively for personal, non-commercial use, and may not be used for any purpose other than to identify prospective properties consumers may be interested in purchasing. Information is deemed reliable but not guaranteed.
Nearby Homes
- 430 La Canada Ave
- 340 Borrego Ave Unit 93
- 265 Gaviota Place Unit SP147
- 4105 Bradfield Dr Unit 55
- 140 Borrego Ave Unit 174
- 3805 Samuel Dr Unit 183
- 0 Saviers Rd
- 411 Percy St Unit 25
- 3011 Fournier St
- 4241 Hamilton Ave
- 4526 Saviers Rd
- 1004 Cheyenne Way
- 237 Lark St
- 2951 Albany Dr
- 4578 Saviers Rd
- 4117 S C St
- 510 E Dollie St
- 721 Helena Ct
- 4340 Highland Ave
- 421 Andrea Dr